

SPX6900 Price Forecast: SPX bears take control, signaling further downside

- SPX6900 price trades in red on Tuesday after facing rejection from a previously broken trendline.
- Derivatives data show falling Open Interest and a rise in bearish positions, suggesting growing downside pressure.
- The technical outlook suggests weakness, with bears targeting a drop toward the $0.81 level.
SPX6900 (SPX) price slides down by nearly 5%, trading around $0.98 at the time of writing on Tuesday after facing rejection from a previously broken trendline. The derivatives data projects a bearish sentiment, with SPX’s Open Interest (OI) falling and bearish bets rising among traders. The technical side further supports a bearish outlook, suggesting that SPX6900 could extend its decline toward the $0.81 level in the upcoming days.
SPX derivatives data show bearish bias
Coinglass’s futures Open Interest for the SPX meme coin drops to $9.94 million on Tuesday, compared to $18.96 million on October 7. This drop in OI, constantly falling since July, signals waning investor participation and reinforces a weakening market sentiment for the SPX meme coin.
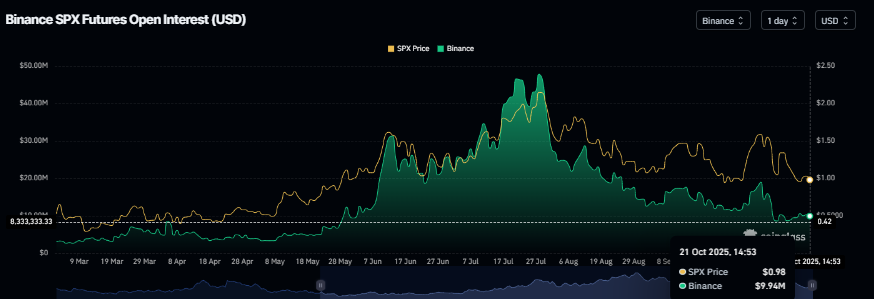
SPX Open Interest chart. Source: Coinglass
Another derivatives metric that strengthens the bearish thesis is CoinGlass’s long-to-short ratio for SPX at 0.86 on Tuesday, the lowest level in over a month, rising bearish bets among traders.
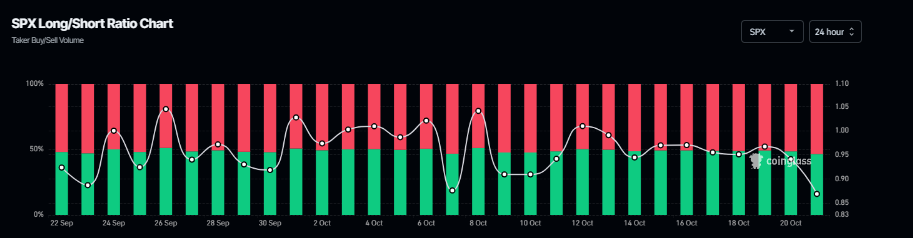
SPX long-to-short ratio chart. Source: Coinglass
SPX6900 Price Forecast: SPX faces rejection from the previously broken trendline
SPX6900 price corrected more than 24% in the previous week after facing rejection around the 50-day Exponential Moving Average (EMA). SPX recovered slightly during the weekend and extended gains on Monday. At the time of writing on Tuesday, SPX trades down by nearly 5% at around $0.98, facing rejection from a previously broken trendline.
If SPX continues its correction, it could extend the decline toward the May 27 low of $0.81.
The Relative Strength Index (RSI) indicator on the daily chart reads 41, below the neutral level of 50, indicating bearish momentum gaining traction. Additionally, the Moving Average Convergence Divergence (MACD) showed a bearish crossover last week, which remains in effect, further supporting the bearish view.
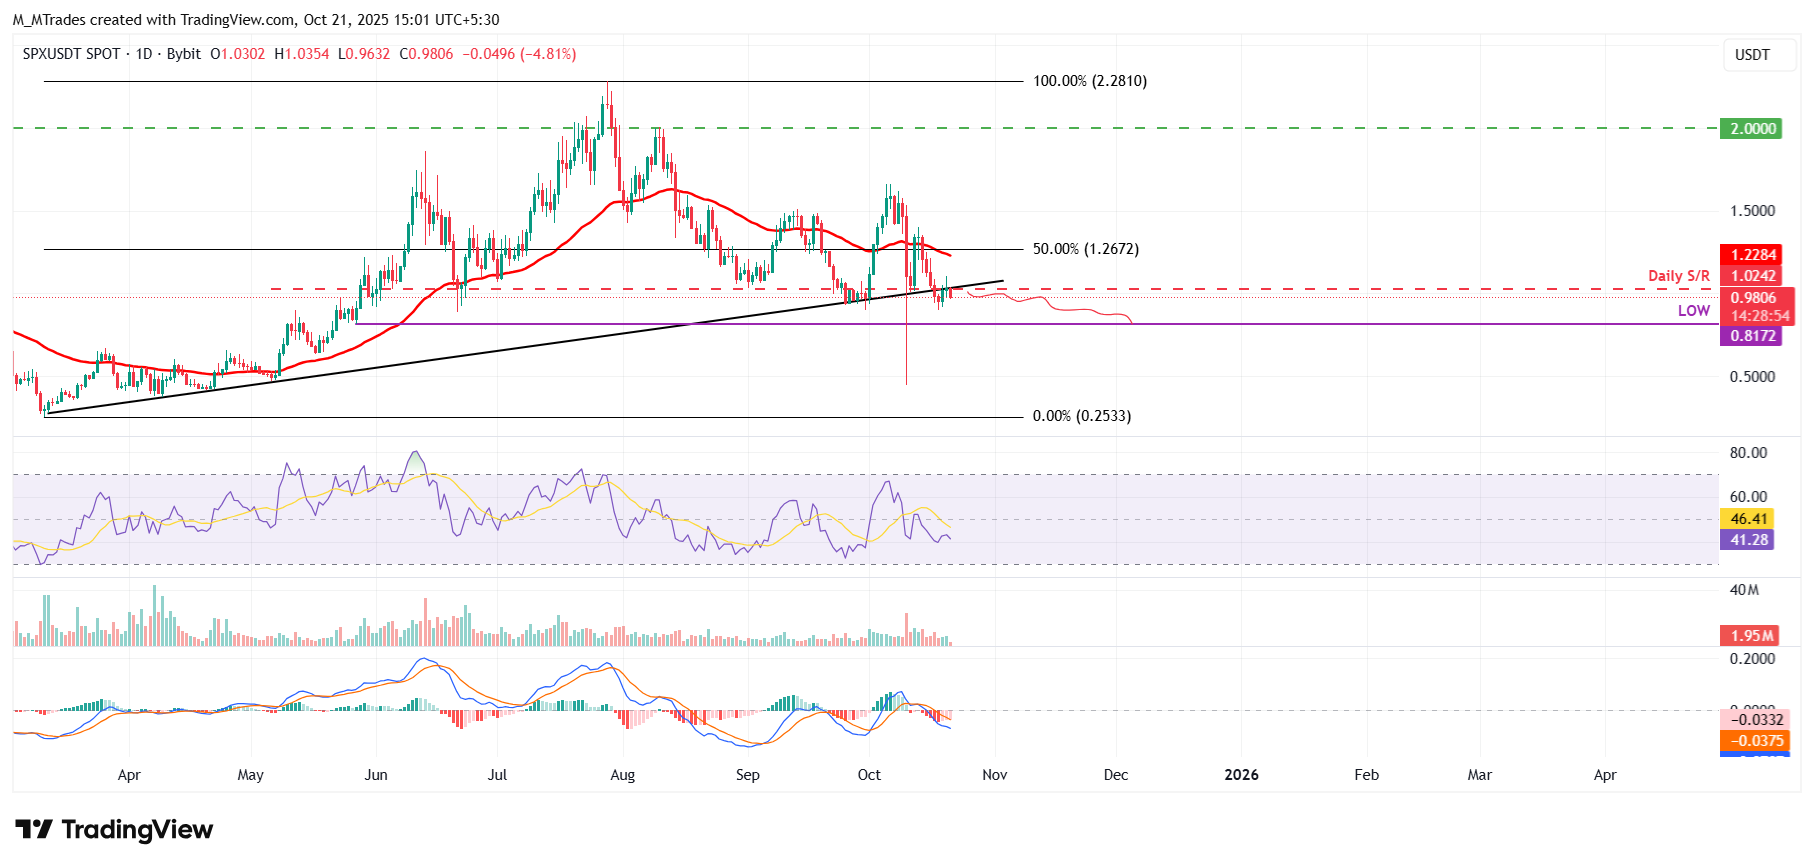
SPX/USDT daily chart
On the other hand, if SPX recovers and closes above the ascending trendline, it could extend the recovery toward the 50-day EMA, currently at $1.22.
Related Articles
Amazon Stock Predictions for 2026 to 2030: Will They Exceed Expectations and Achieve Major Long-Term Goals?
TradingKey - As we head into 2026, many investors are questioning where Amazon (AMZN) fits into the technology world.
A Crash After a Surge: Why Silver Lost 40% in a Week?
TradingKey - Spot silver (XAGUSD) prices continue to decline. Silver plunged 20% on Thursday, breaking below $71 per ounce, with the sell-off intensifying on Friday as prices fell further below $64. Compared to the all-time high set on January 29, silver prices have retraced more than 40%, wiping out nearly all gains accumulated over the previous month.
Is Bitcoin’s Four-Year Cycle Dead in 2026?
Is the Bitcoin 4-year cycle dead? After 2025 broke historical records with a red post-halving year, institutional analysts explore if the Bitcoin price has decoupled from the halving countdown. Analyze the impact of spot ETFs, global liquidity, and the roadmap to the 2028 halving in this 2026 market
USD Dollar Trend Forecast: Dollar Index Falls Below 97.0 to 4-Year Low, Will the Dollar Continue To Fall or Bottom Out in 2026?
TradingKey - In January 2026, the US Dollar Index continued its downward trend from 2025, officially breaking below the key 97.0 level and reaching a low of 95.5, marking a nearly four-year low since February 2022.

