

Cardano Price Forecast: ADA correction deepens as profit-taking activity increases

- Cardano price steadies around $0.81 on Friday after falling more than 3% so far this week.
- Metrics support further correction as profit-taking activity rises and bearish bets reach the highest monthly level.
- The technical analysis paints a bearish trend as indicators show signs of weakening momentum.
Cardano (ADA) price steadies at around $0.81 at the time of writing on Friday after falling more than 3% so far this week. On-chain and derivatives data further hint at a correction as profit-taking rises while bearish bets reach the highest level among ADA traders. Adding to this, the technical outlook suggests a downward trend on the horizon as indicators show signs of weakening momentum.
Profit-taking activity and bearish bets reach the highest monthly level
Santiment's Network Realized Profit/Loss (NPL) metric indicates that Cardano holders are booking some profits this week.
As shown in the chart below, the metric experienced a strong spike on Thursday, reaching its highest level since September 23. This spike indicates that holders are, on average, selling their bags at a significant profit, thereby increasing the selling pressure.
 [08-1760069792308-1760069792310.41.06, 10 Oct, 2025].png)
ADA NPL chart. Source: Santiment
On the derivatives side, CoinGlass’s ADA long-to-short ratio, which stands at 0.81 on Friday, is the highest level over a month. This ratio, below one, reflects bearish sentiment in the markets, as more traders are betting on the asset price to fall.
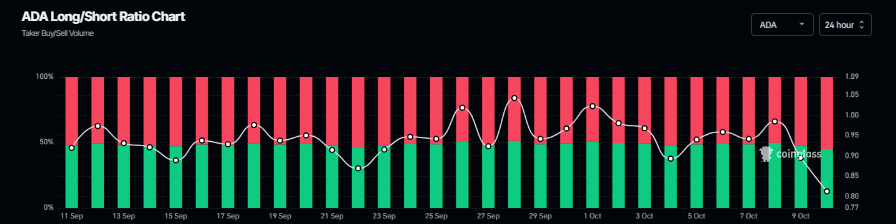
Cardano long-to-short chart. Source: CoinGlass
Cardano Price Forecast: ADA shows weakness in momentum
Cardano price failed to find support around the daily support level at $0.84 on Tuesday and corrected nearly 6%, closing below the 61.8% Fibonacci retracement level at $0.82. On Wednesday, ADA recovered slightly but faced rejection from the daily level the next day. At the time of writing on Friday, it trades at around $0.81.
If ADA continues its pullback, breaks and closes below the ascending trendline, it could extend the correction toward the next daily support at $0.70.
The Relative Strength Index (RSI) on the daily chart reads 45, which is below the neutral level of 50, indicating that bearish momentum is gaining traction. The Moving Average Convergence Divergence (MACD) lines flipped a bearish crossover on Thursday, giving sell signals and suggesting the start of a downward trend ahead.
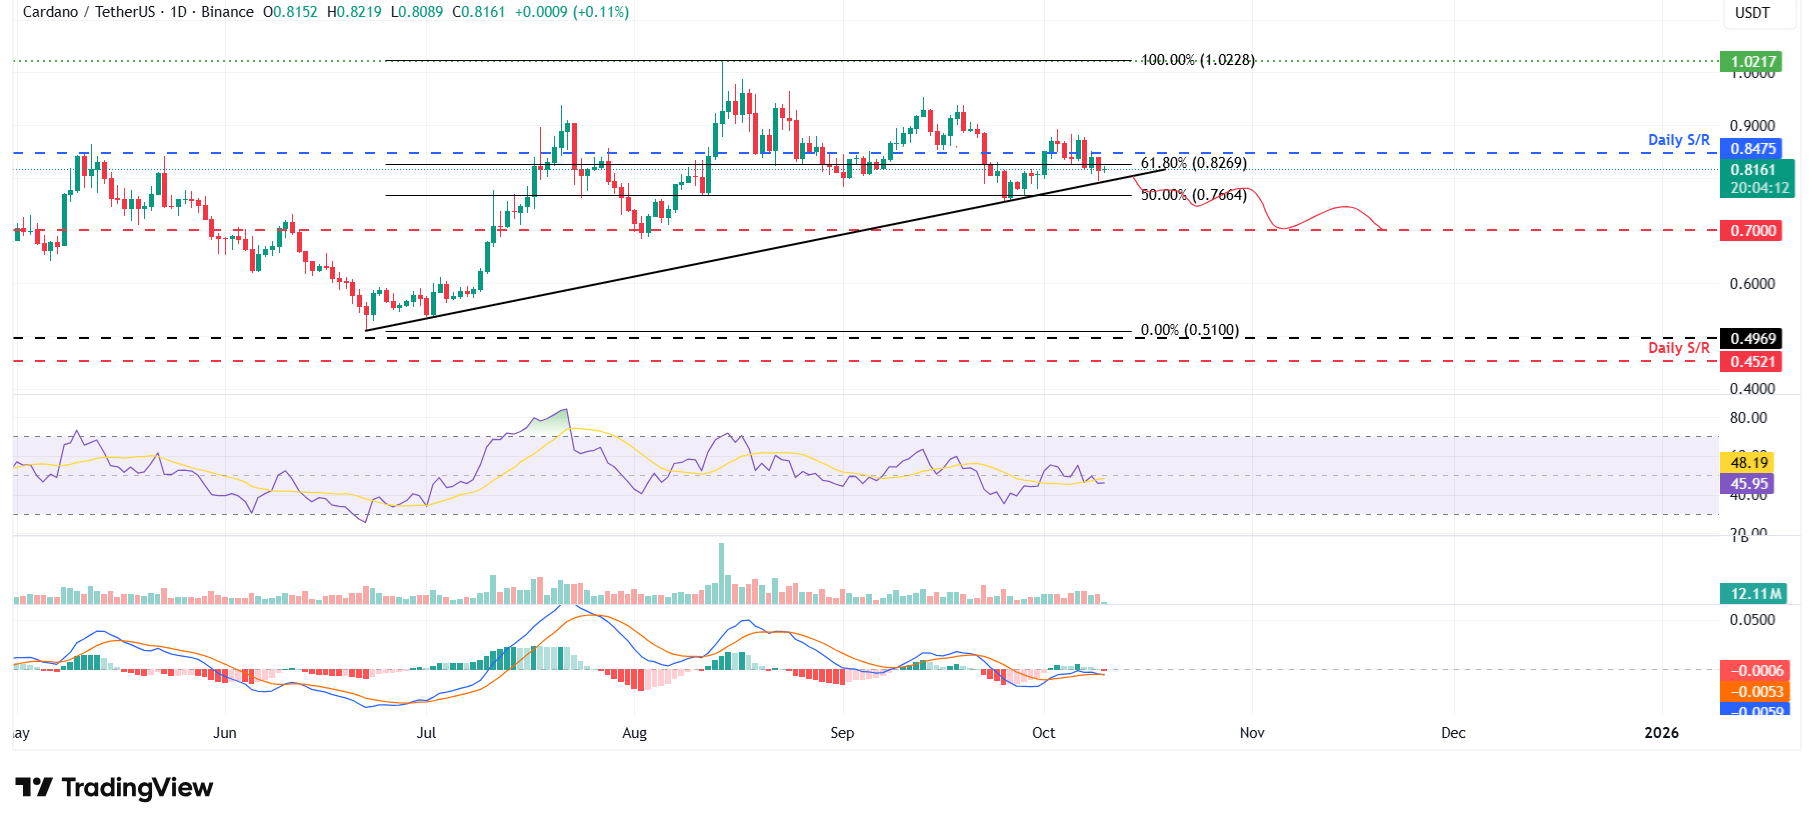
ADA/USDT daily chart
However, if ADA recovers, closes above the daily level at $0.84 and holds, it could extend the rally toward the psychological level at $1.
Related Articles
Amazon Stock Predictions for 2026 to 2030: Will They Exceed Expectations and Achieve Major Long-Term Goals?
TradingKey - As we head into 2026, many investors are questioning where Amazon (AMZN) fits into the technology world.
A Crash After a Surge: Why Silver Lost 40% in a Week?
TradingKey - Spot silver (XAGUSD) prices continue to decline. Silver plunged 20% on Thursday, breaking below $71 per ounce, with the sell-off intensifying on Friday as prices fell further below $64. Compared to the all-time high set on January 29, silver prices have retraced more than 40%, wiping out nearly all gains accumulated over the previous month.
Google Cloud Revenue Surges 48% in Q4 as CapEx Guidance Nearly Doubles: Why the 7.5% After-Hours Dip?
TradingKey - After the close on February 4 (ET), Google (GOOG, GOOGL) released stellar Q4 results: total revenue grew 18% year-over-year, hitting a new quarterly record after revenue first surpassed $100 billion in Q3. The primary highlight was Google Cloud, where Q4 revenue surged 48% year-over-yea
Is Bitcoin’s Four-Year Cycle Dead in 2026?
Is the Bitcoin 4-year cycle dead? After 2025 broke historical records with a red post-halving year, institutional analysts explore if the Bitcoin price has decoupled from the halving countdown. Analyze the impact of spot ETFs, global liquidity, and the roadmap to the 2028 halving in this 2026 market

