

Hyperliquid Price Forecast: HYPE bears in control of momentum

- Hyperliquid price extends decline on Tuesday after facing rejection from a previously broken trendline.
- Derivatives data paint a bearish outlook as HYPE traders' short bets reach the highest level in over a month.
- Technical analysis suggests a potential correction ahead as momentum indicators indicate a bearish trend.
Hyperliquid (HYPE) extends its decline for the fifth consecutive day, trading below $46 at the time of writing on Tuesday after facing rejection from a key resistance level. Derivatives data further support the bearish thesis, as short bets reach their highest level in over a month. Moreover, the technical outlook suggests a potential correction ahead, as momentum indicators display a downward trend.
HYPE derivatives data show bearish bias
Coinglass' long-to-short ratio reads 0.80 on Tuesday, marking the lowest level in over a month. A ratio below one indicates bearish sentiment in the market, as traders are betting that the asset price will decline.
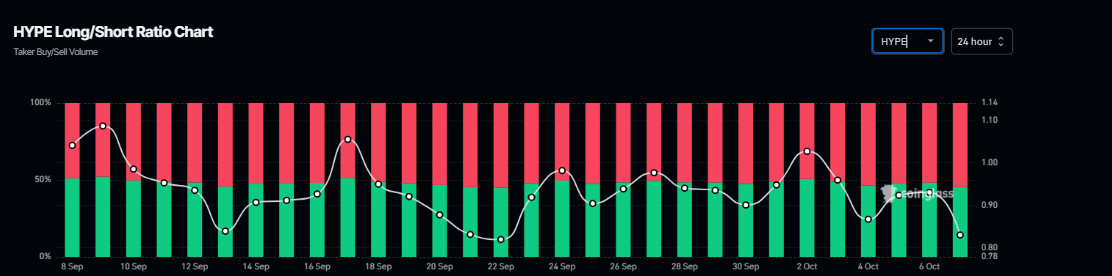
HYPE long-to-short ratio chart. Source: Coinglass
CryptoQuant’s chart below shows that Hyperliquid’s spot volume bubble map indicators suggest a spot market activity condition that is overheating, which could further fuel the price decline in HYPE.
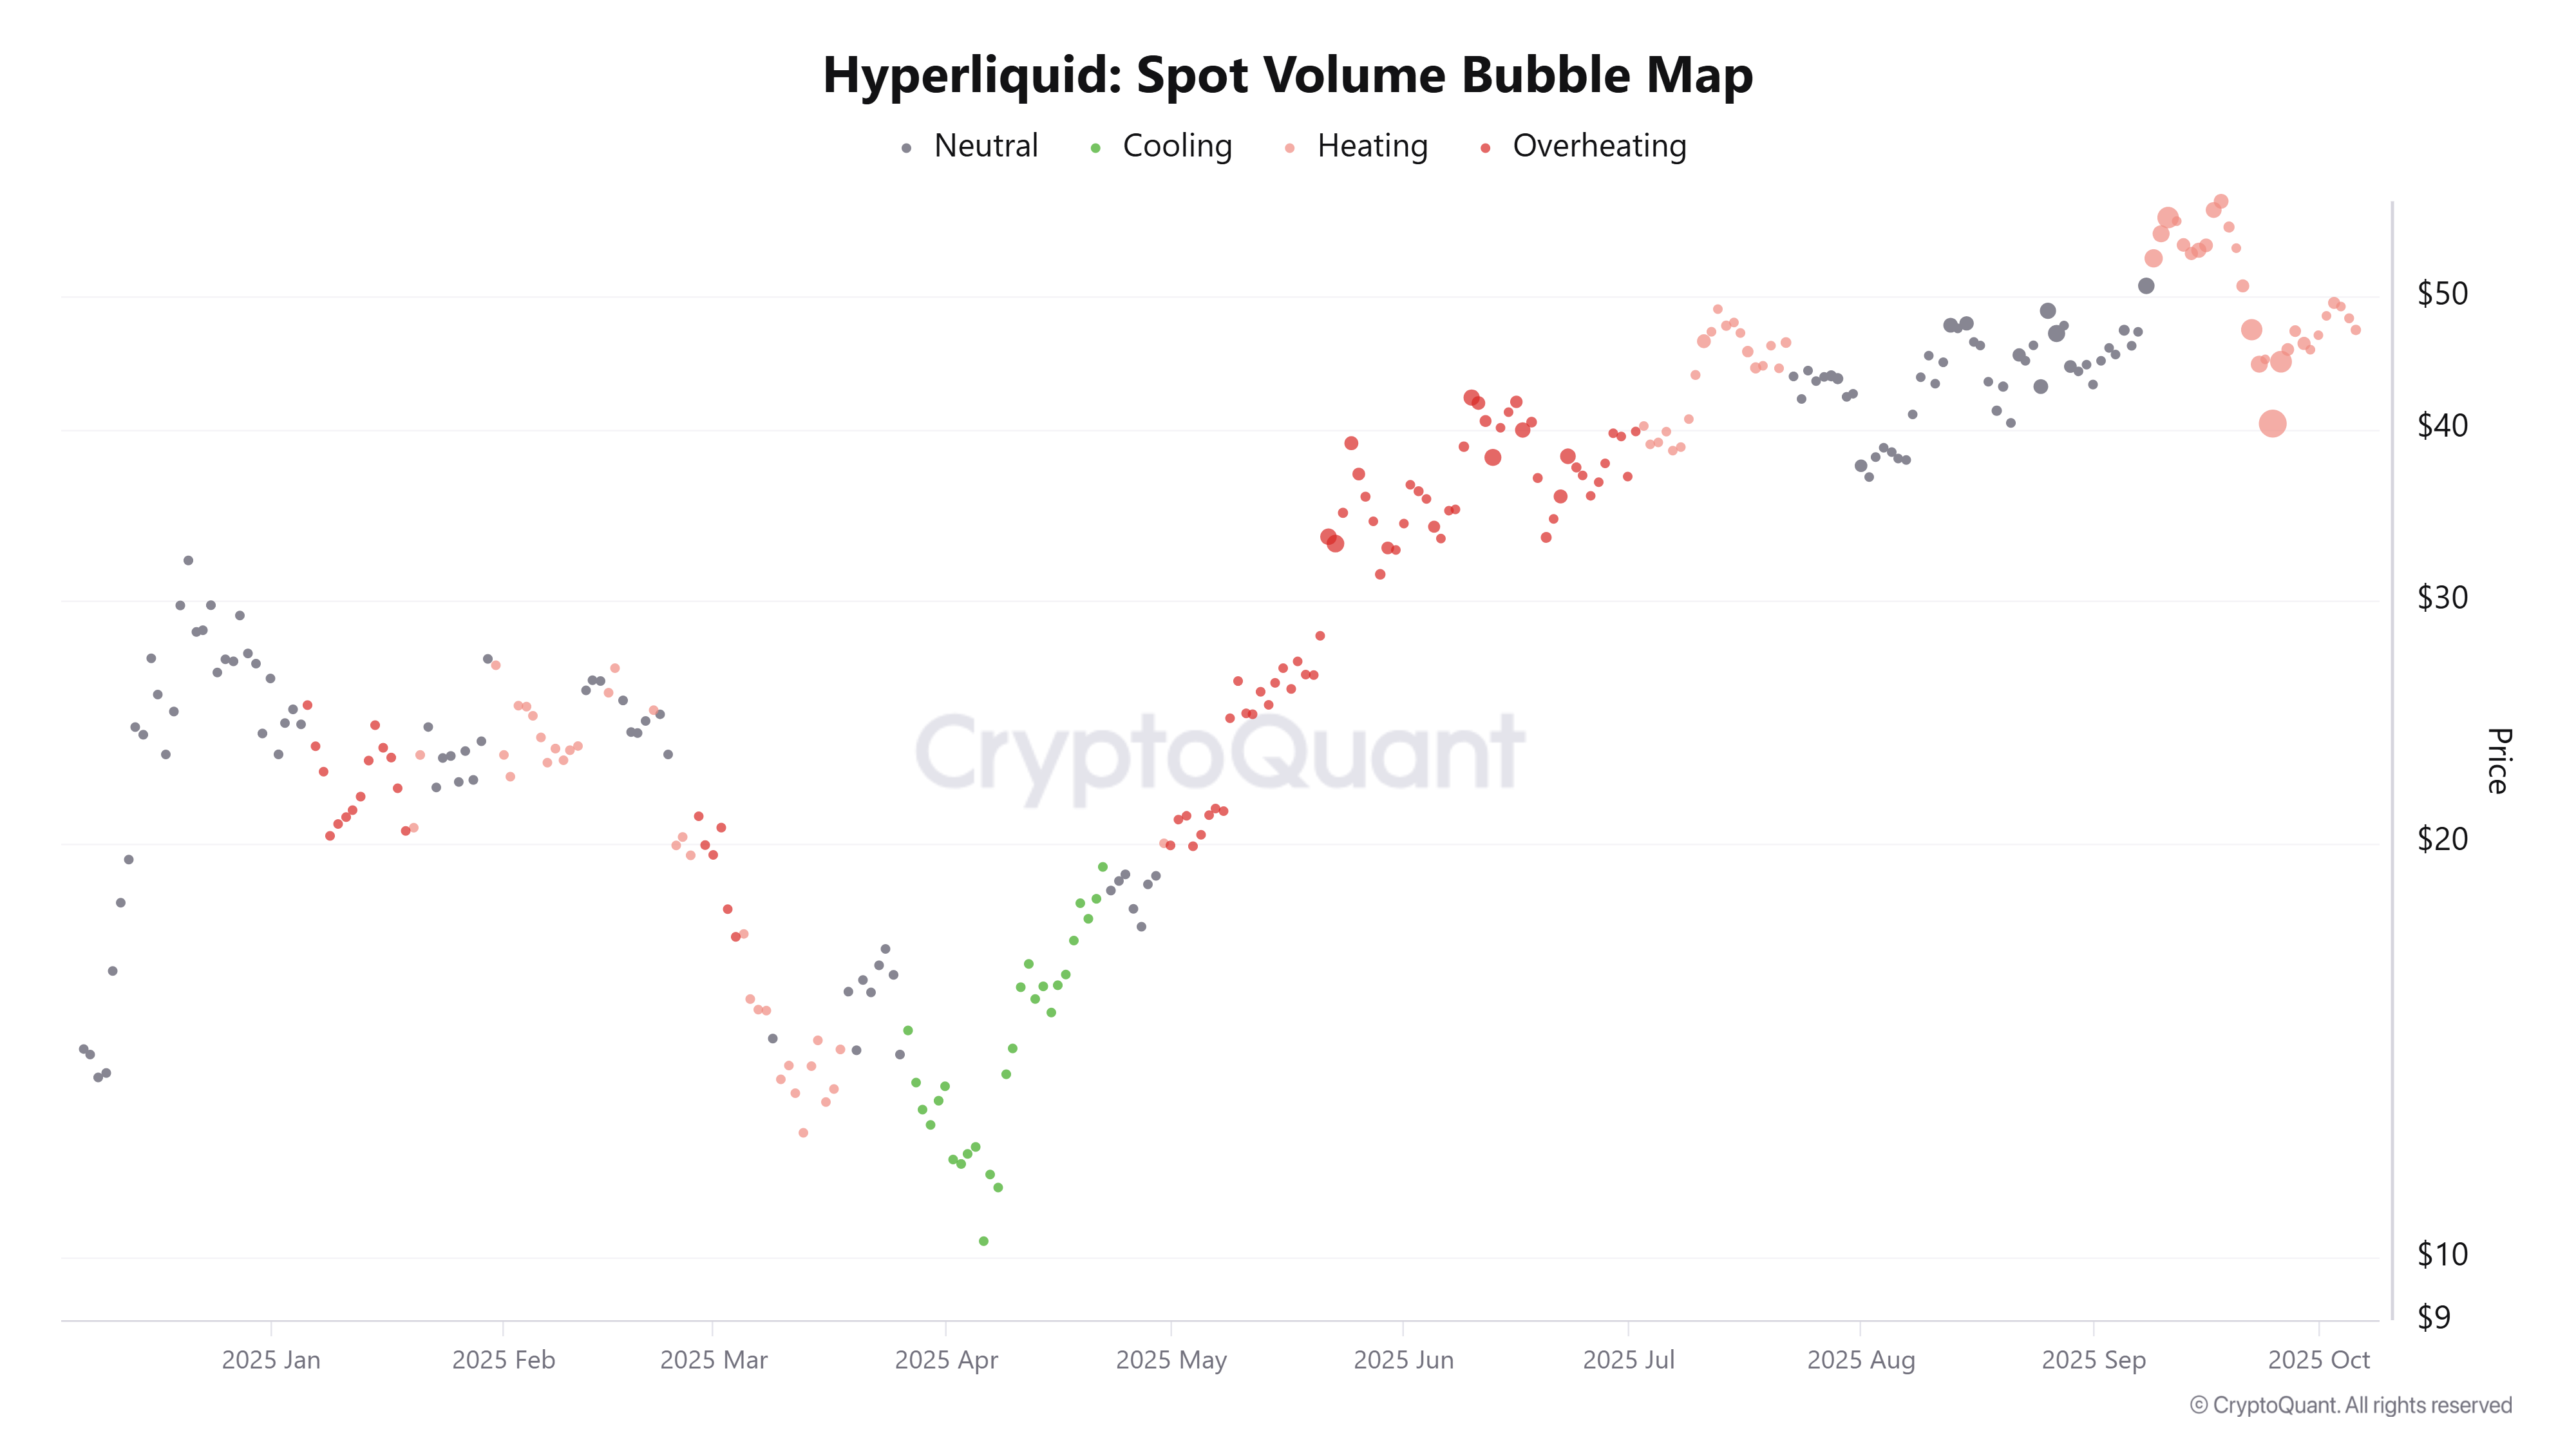
Hyperliquid spot volume bubble map chart. Source: CryptoQuant
Hyperliquid Price Forecast: HYPE bears aiming for levels below $40
Hyperliquid price faced rejection from a previously broken ascending trendline (drawn by connecting multiple lows since early April) on Friday and declined by nearly 7% by Monday. At the time of writing on Tuesday, HYPE continues to trade down at around $45.90.
If HYPE continues its downward trend, it could extend the decline toward the daily support at $39.11.
The Relative Strength Index (RSI) on the daily chart reads 45, extending the decline below its neutral level of 50 and indicating that bearish momentum is gaining traction. Moreover, the Moving Average Convergence Divergence (MACD) indicator is showing a bearish crossover on Tuesday, further supporting the bearish view.
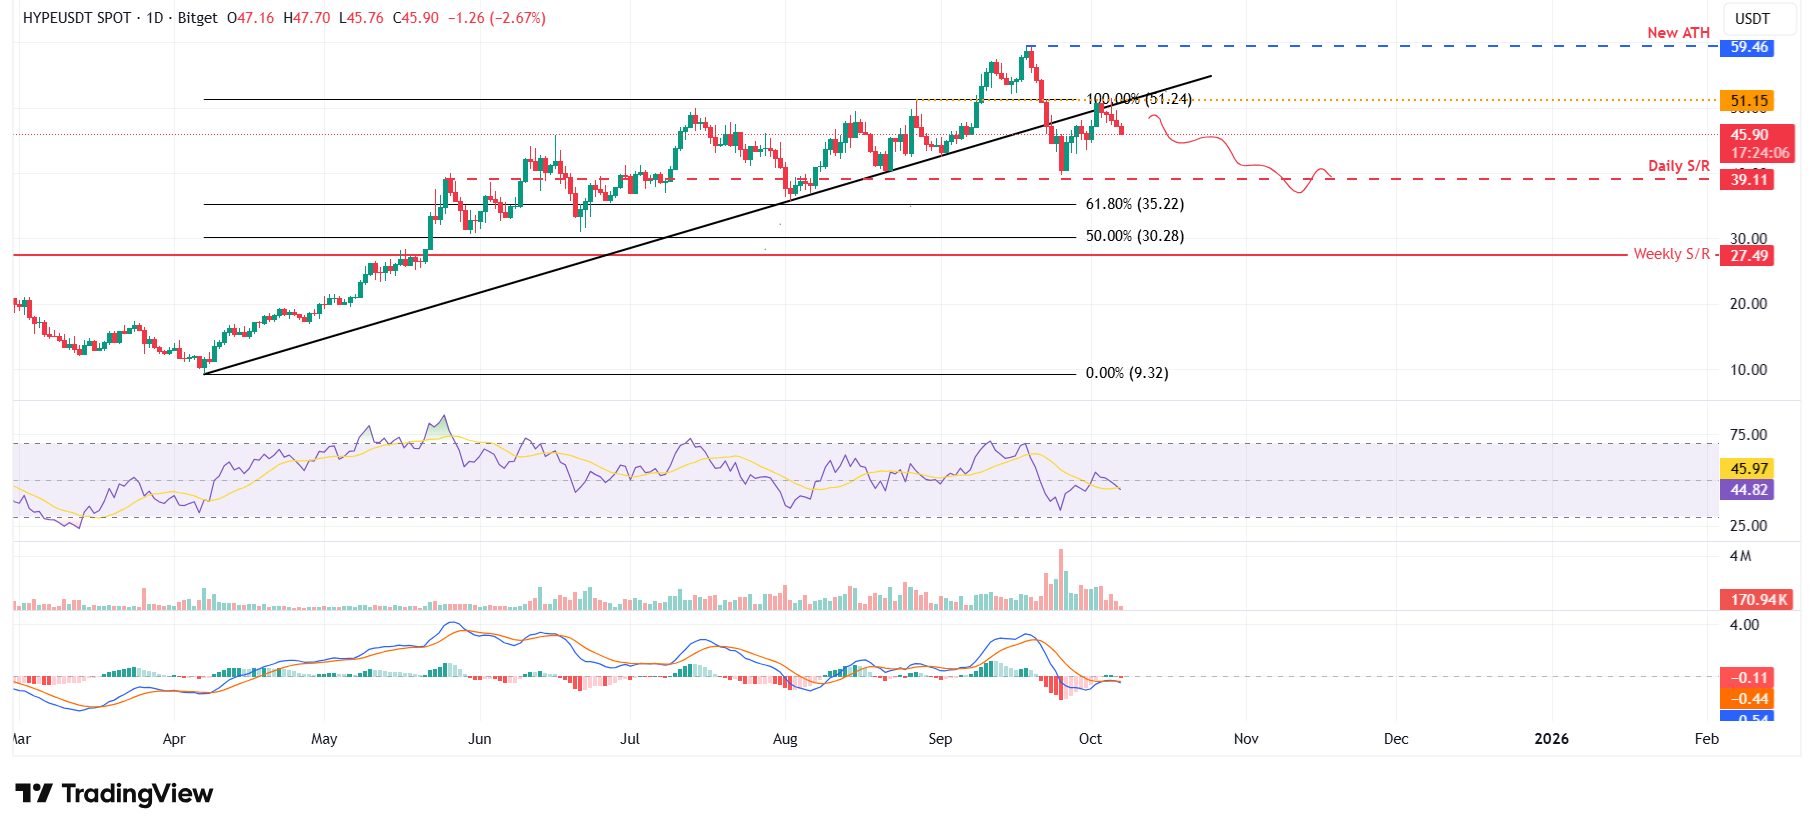
HYPE/USDT daily chart
However, if HYPE recovers, it could extend the recovery toward the daily resistance level at $51.15.
Related Articles
Amazon Stock Predictions for 2026 to 2030: Will They Exceed Expectations and Achieve Major Long-Term Goals?
TradingKey - As we head into 2026, many investors are questioning where Amazon (AMZN) fits into the technology world.
A Crash After a Surge: Why Silver Lost 40% in a Week?
TradingKey - Spot silver (XAGUSD) prices continue to decline. Silver plunged 20% on Thursday, breaking below $71 per ounce, with the sell-off intensifying on Friday as prices fell further below $64. Compared to the all-time high set on January 29, silver prices have retraced more than 40%, wiping out nearly all gains accumulated over the previous month.
Is Bitcoin’s Four-Year Cycle Dead in 2026?
Is the Bitcoin 4-year cycle dead? After 2025 broke historical records with a red post-halving year, institutional analysts explore if the Bitcoin price has decoupled from the halving countdown. Analyze the impact of spot ETFs, global liquidity, and the roadmap to the 2028 halving in this 2026 market
USD Dollar Trend Forecast: Dollar Index Falls Below 97.0 to 4-Year Low, Will the Dollar Continue To Fall or Bottom Out in 2026?
TradingKey - In January 2026, the US Dollar Index continued its downward trend from 2025, officially breaking below the key 97.0 level and reaching a low of 95.5, marking a nearly four-year low since February 2022.

