

AAVE Price Forecast: AAVE’s Total Value Locked reaches a new all-time high of $44.8 billion

- Aave price trades in the green on Friday, having gained nearly 6% so far this week.
- DefiLlama data show that AAVE’s TVL reaches a record high of $44.89 billion, highlighting growing interest among investors.
- The technical outlook suggests a continuation of the rally, as momentum indicators display a bullish bias.
Aave (AAVE) price trades in green, above $290 at the time of writing on Friday, after gaining nearly 6% so far this week. The bullish outlook is further strengthened as the Total Value Locked (TVL) reaches a record high of over $44 billion, indicating growing investor interest. From a technical view, momentum indicators suggest a bullish bias, indicating the continuation of the ongoing rally.
AAVE TVL hits record highs
Crypto intelligence tracker DefiLlama’s data shows that Aave’s TVL has increased to a new all-time high of $44.89 billion on Friday. Rising TVL indicates growing activity and interest within AAVE’s ecosystem, suggesting that more users are depositing or utilizing assets within AAVE-based protocols.
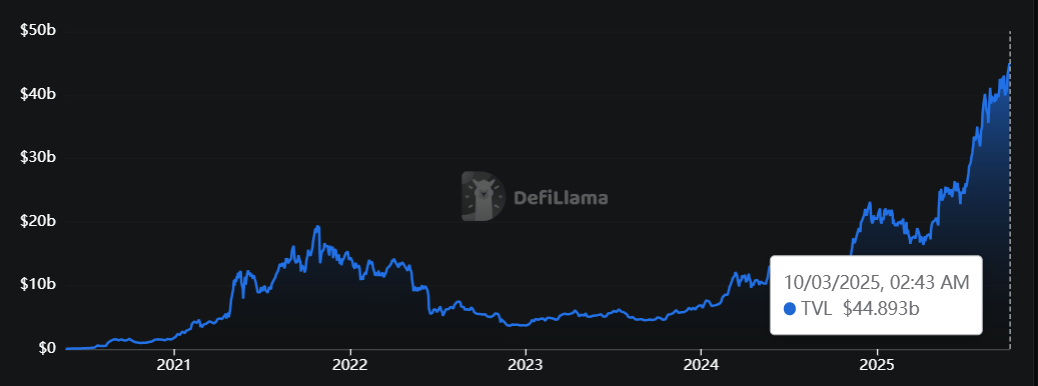
AAVE TVL chart. Source: DefiLlama
On the derivatised front, CryptoQuant’s Futures Volume Bubble Map indicator, which measures the average order size of executed trades for AAVE, is showing larger average order sizes, suggesting increased participation from whale investors, further supporting the bullish view.
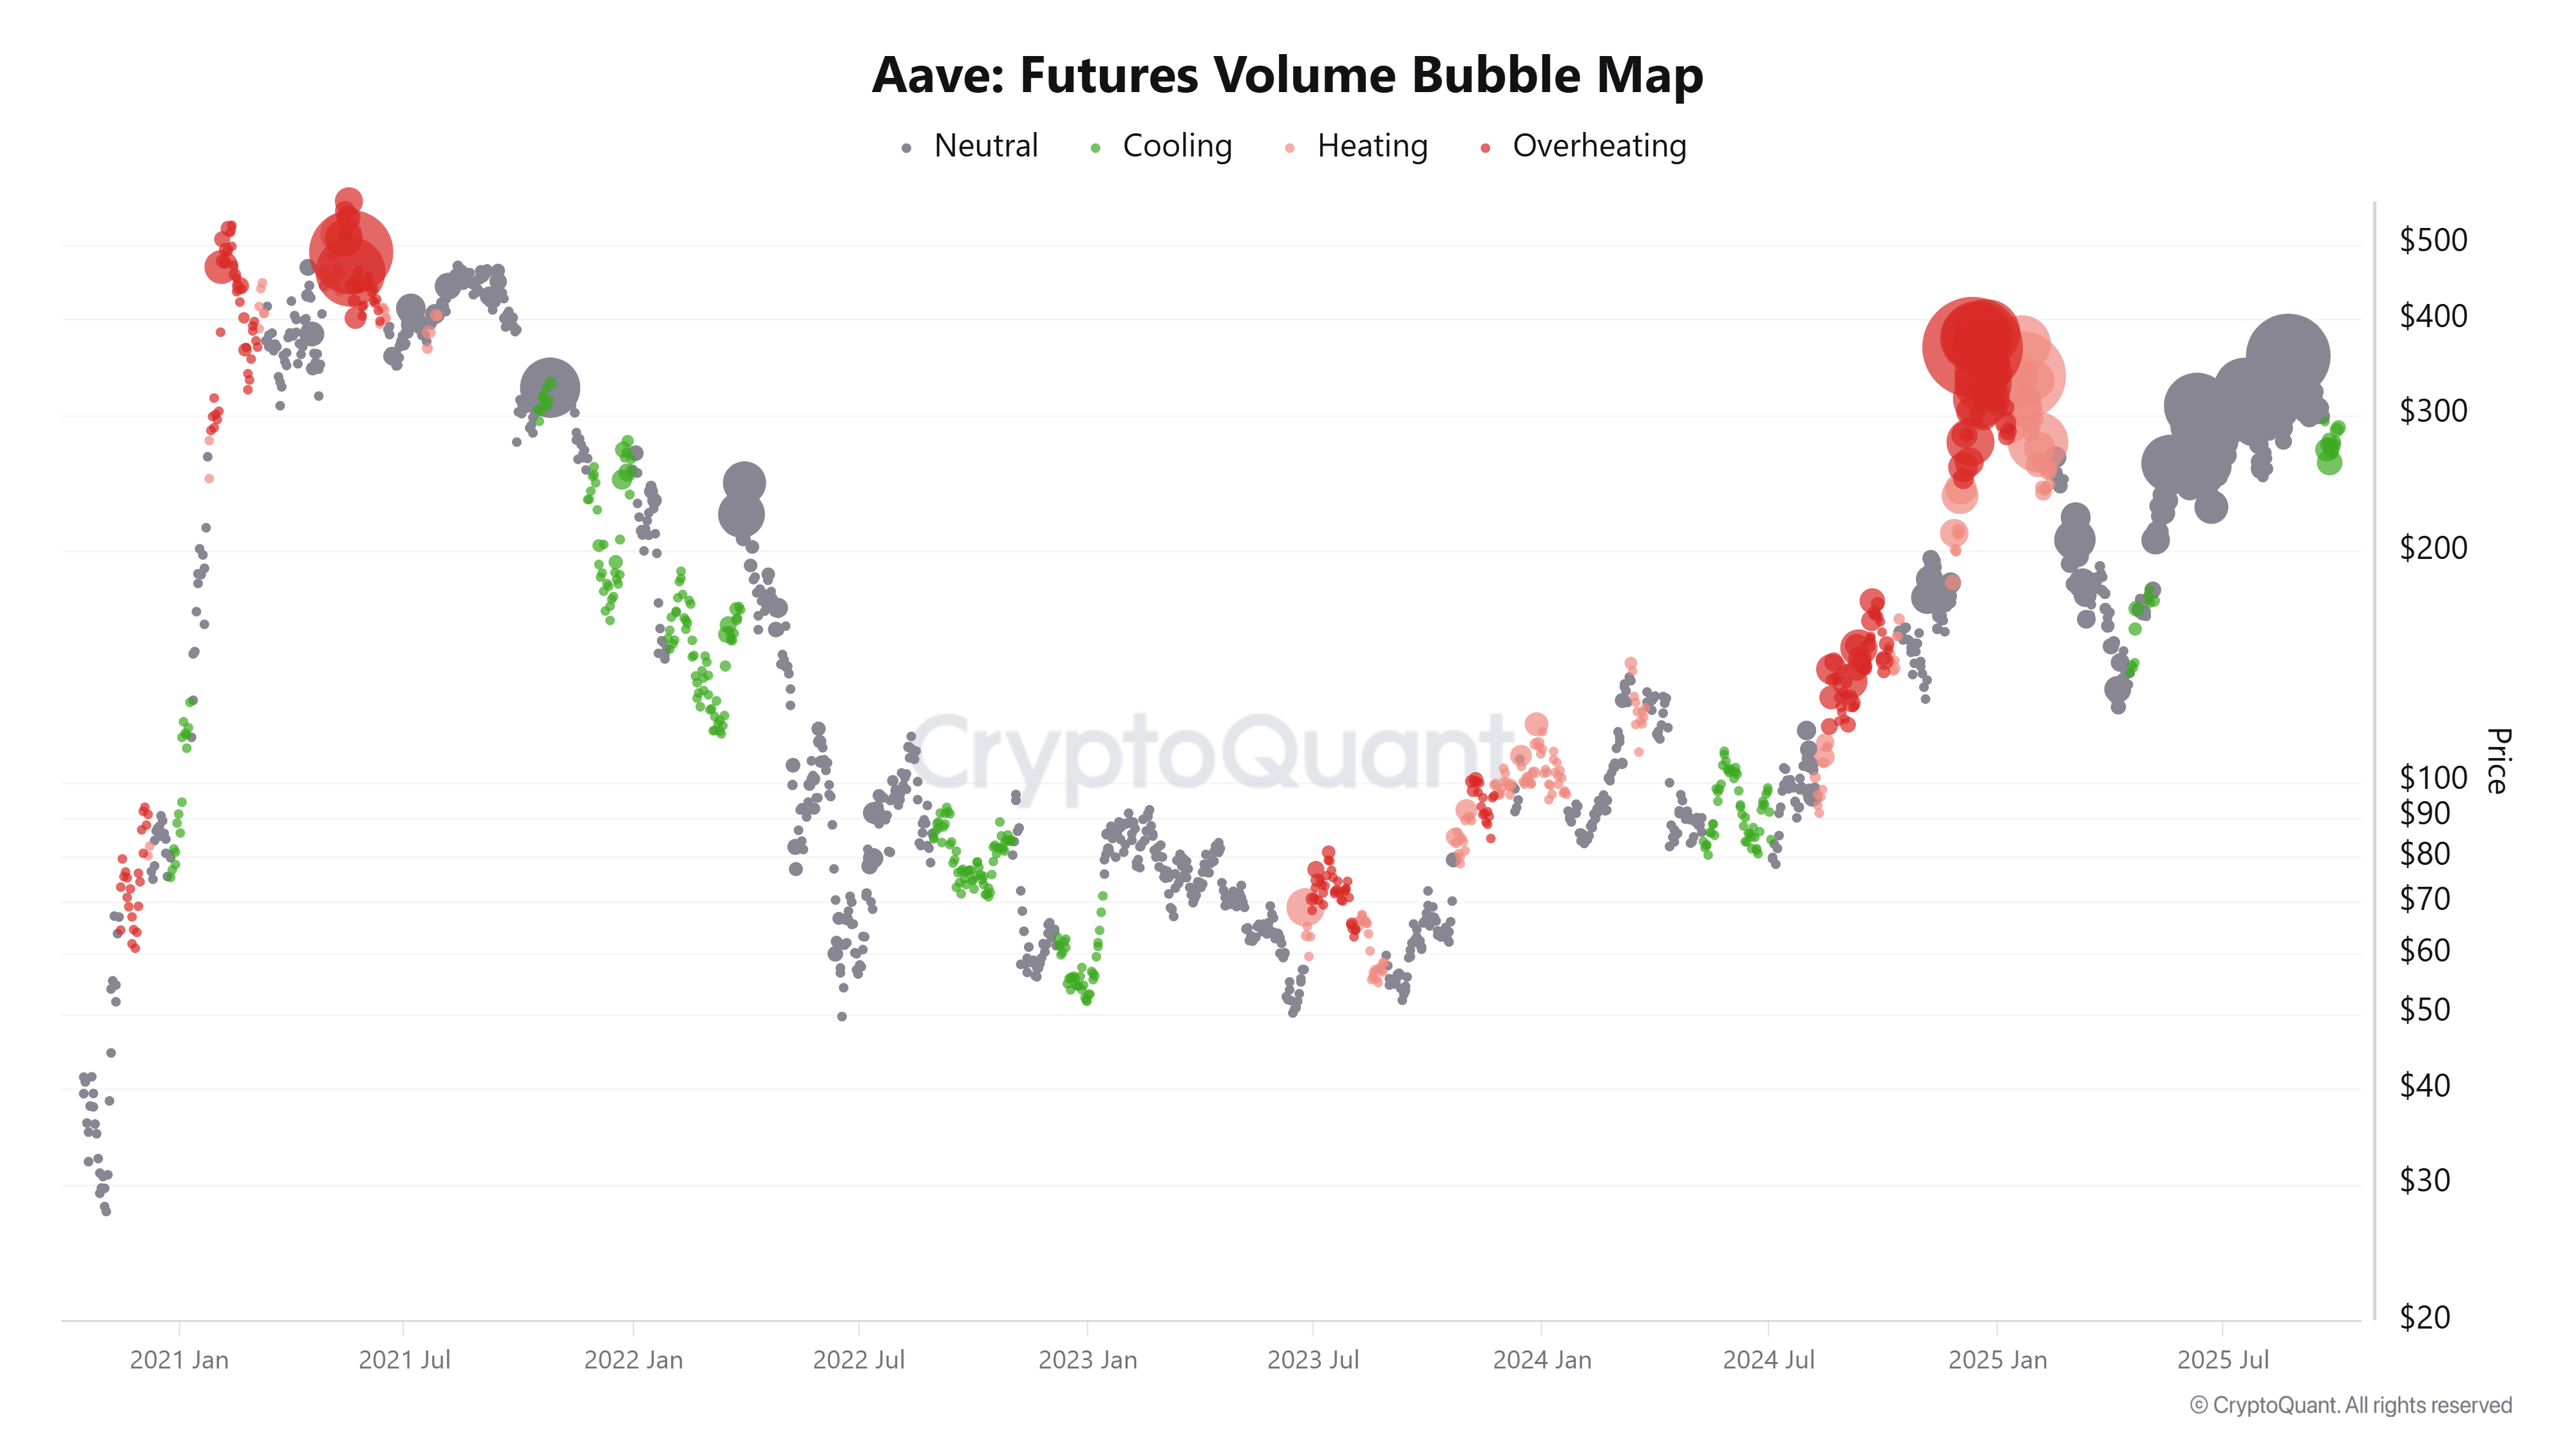
Aave Futures Volume Bubble Map chart. Source: CryptoQuant
Aave Price Forecast: AAVE bulls aiming for $367 mark
Aave price found support around the 50% Fibonacci level at $250.53 (drawn from the April low of $114.05 to the August high of $387.02) last week and recovered, closing above the 200-day Exponential Moving Average (EMA) at $268.05 on Sunday. As of Monday, the start of this week, AAVE continues its recovery, with a 5% increase by Thursday, finding support around the 200-day EMA. At the time of writing on Friday, it hovers at around $290.
If AAVE continues its upward trend, it could extend the rally toward its daily resistance level at $367.11.
The Relative Strength Index (RSI) on the daily chart is moving above the neutral level of 50, indicating fading bearish momentum. The Moving Average Convergence Divergence (MACD) displayed a bullish crossover on Thursday, signaling a buy opportunity and indicating the potential start of an upward trend.
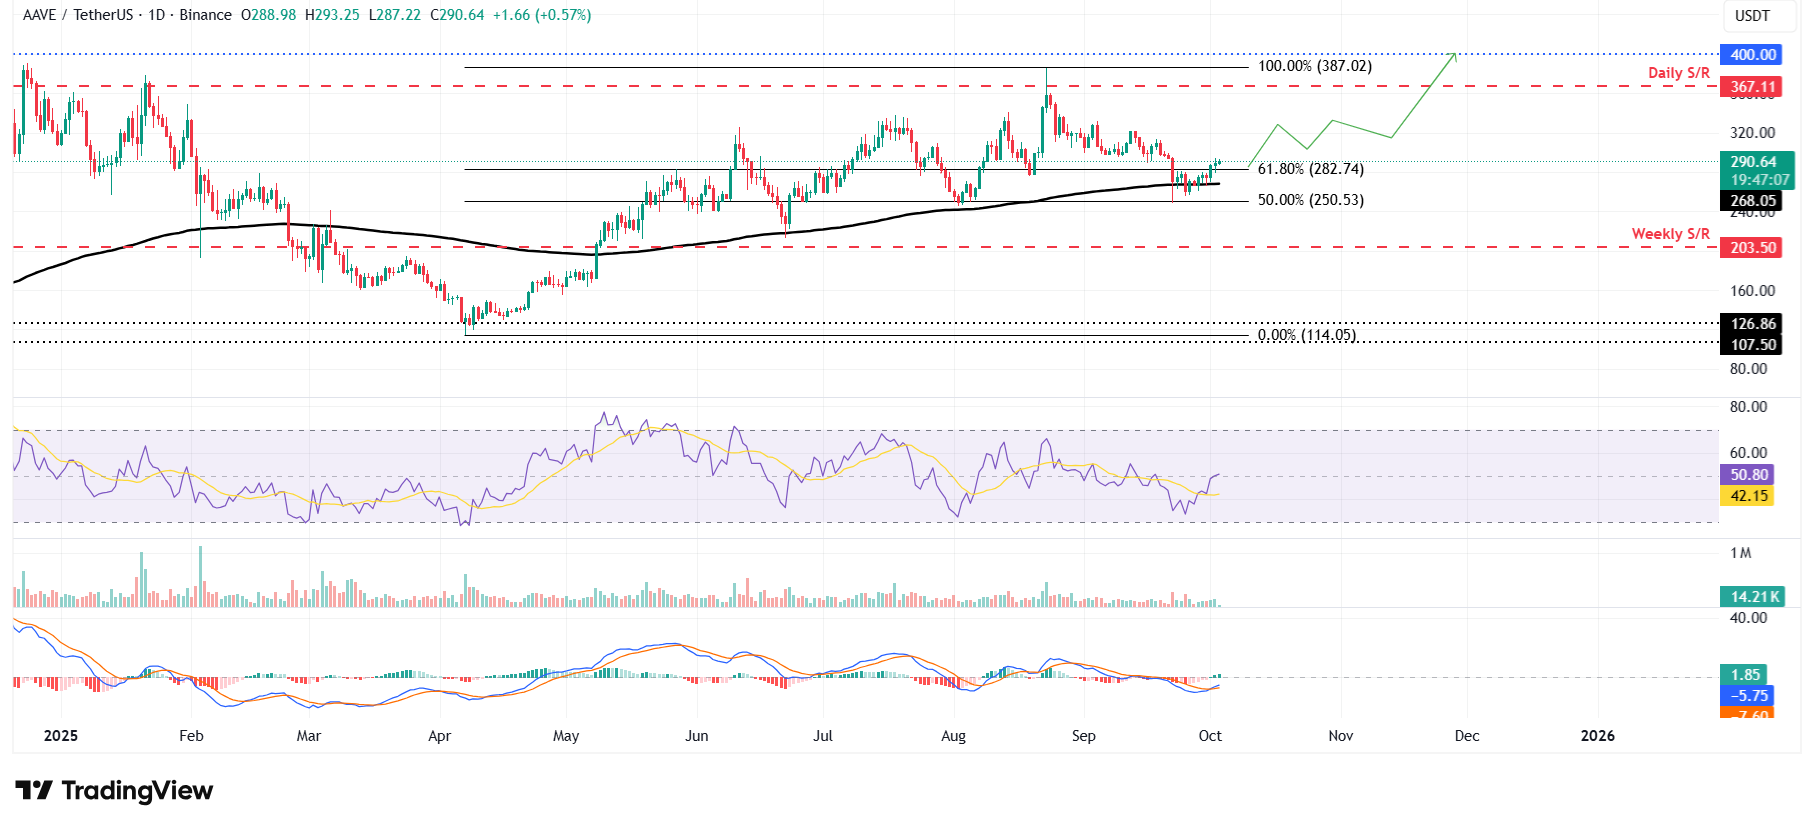
AAVE/USDT daily chart
However, if AAVE faces a correction, it could extend the decline toward the 200-day EMA at $268.05.
Related Articles
Amazon Stock Predictions for 2026 to 2030: Will They Exceed Expectations and Achieve Major Long-Term Goals?
TradingKey - As we head into 2026, many investors are questioning where Amazon (AMZN) fits into the technology world.
A Crash After a Surge: Why Silver Lost 40% in a Week?
TradingKey - Spot silver (XAGUSD) prices continue to decline. Silver plunged 20% on Thursday, breaking below $71 per ounce, with the sell-off intensifying on Friday as prices fell further below $64. Compared to the all-time high set on January 29, silver prices have retraced more than 40%, wiping out nearly all gains accumulated over the previous month.
Is Bitcoin’s Four-Year Cycle Dead in 2026?
Is the Bitcoin 4-year cycle dead? After 2025 broke historical records with a red post-halving year, institutional analysts explore if the Bitcoin price has decoupled from the halving countdown. Analyze the impact of spot ETFs, global liquidity, and the roadmap to the 2028 halving in this 2026 market
USD Dollar Trend Forecast: Dollar Index Falls Below 97.0 to 4-Year Low, Will the Dollar Continue To Fall or Bottom Out in 2026?
TradingKey - In January 2026, the US Dollar Index continued its downward trend from 2025, officially breaking below the key 97.0 level and reaching a low of 95.5, marking a nearly four-year low since February 2022.

