Meme Coins Price Prediction: Dogecoin, Shiba Inu, and Pepe extend corrections as market sentiment turns cautious

- Dogecoin price resumes its pullback on Monday after sliding 6% in the previous week.
- Shiba Inu price closes below the 50-day EMA, raising the risk of a deeper correction.
- Pepe price trades lower, with momentum indicators flashing bearish signals.
Meme coins face renewed selling pressure at the start of this week on Monday, with Dogecoin (DOGE), Shiba Inu (SHIB), and Pepe (PEPE) extending their losses after recent corrections. The technical outlook of these meme coins signals a bearish momentum, suggesting further losses in the upcoming days.
Dogecoin Price Forecast: DOGE extends losses
Dogecoin price faced a correction around its daily resistance level of $0.311 on September 13 and declined by 8% over the next two days, finding support at the daily support level of $0.256. DOGE recovered slightly but failed to maintain its gains, declining 6.20% in the previous week. At the start of this week, on Monday, it is extending its correction by 8% so far, trading below $0.239 at the time of writing.
If DOGE continues to correct and closes below its 50-day Exponential Moving Average (EMA) at $0.238, it could extend the correction toward its next daily support at $0.200.
The Relative Strength Index (RSI) on the daily chart reads 45, below its neutral level of 50, indicating bearish momentum. Additionally, the Moving Average Convergence Divergence (MACD) on the same chart shows a bearish crossover on Monday, giving a sell signal and suggesting a potential downward trend ahead.
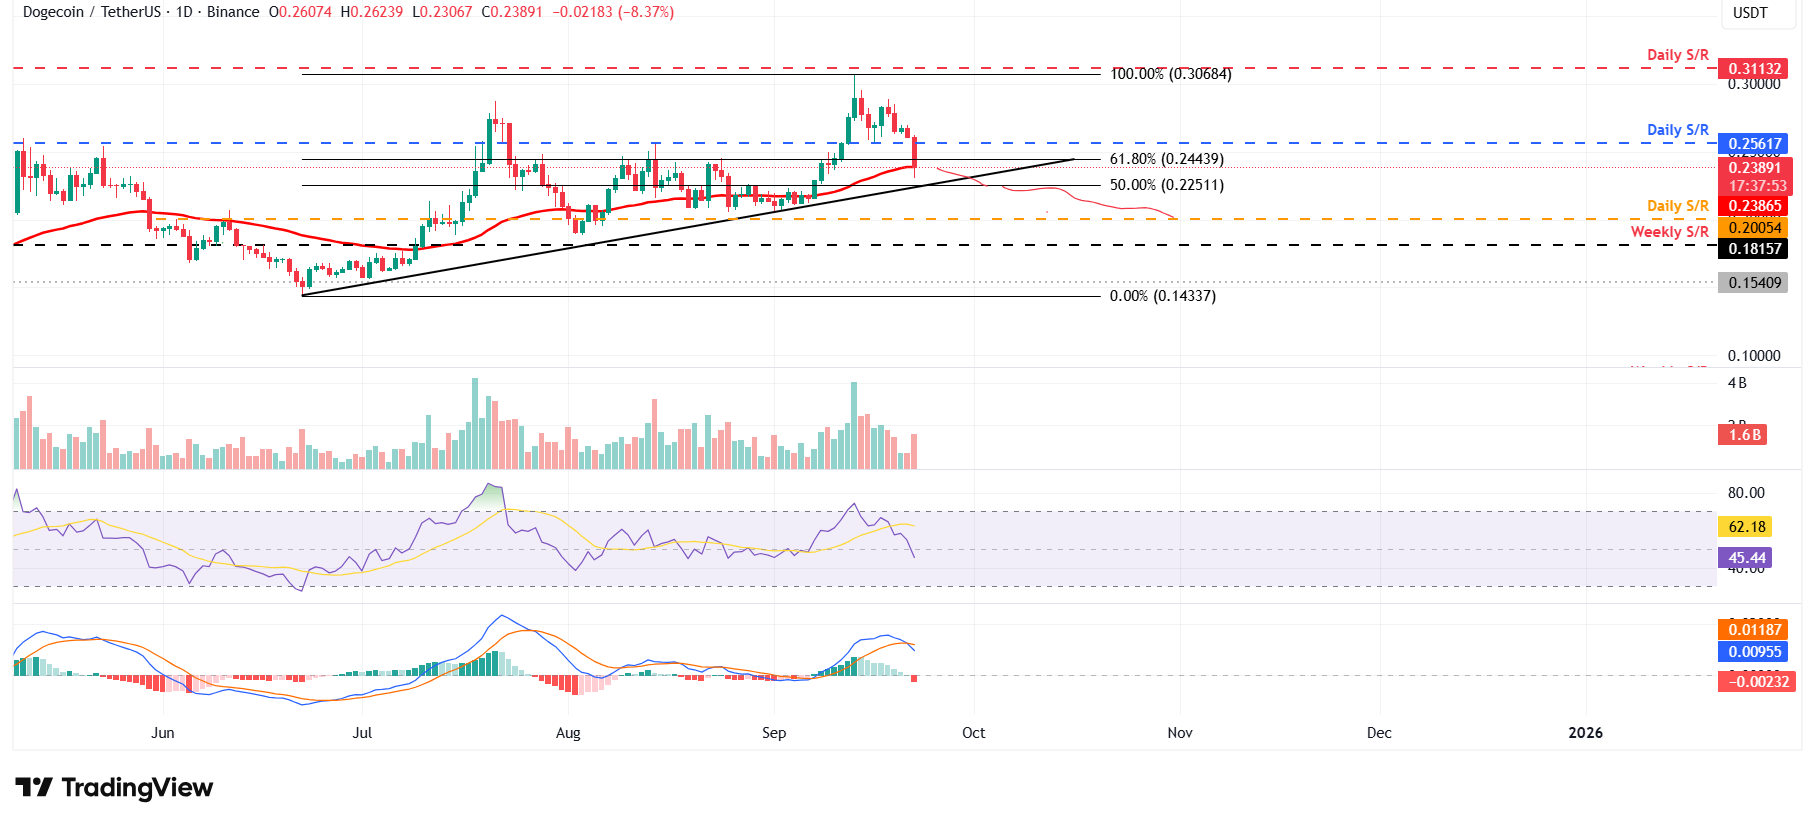
DOGE/USDT daily chart
However, if DOGE finds support around the 50-day EMA at $0.238, it could extend the recovery toward the daily resistance level at $0.311.
Shiba Inu Price Forecast: SHIB bears are in control of momentum
Shiba Inu price found rejection around its 61.8% Fibonacci retracement level at $0.0000147 (drawn from the May 12 high of $0.0000176 to the June 22 low of $0.0000100) on September 13 and declined by nearly 8% by Sunday. At the time of writing on Monday, it continues to trade down at around 0.0000121, breaking below the ascending trendline (drawn by connecting multiple lows since June 22).
If SHIB continues its correction and closes below the daily support at $0.0000118, it could extend the decline to the next daily support at $0.0000106.
The RSI on the daily chart reads 40, below its neutral level of 50, indicating strong bearish momentum. The MACD also showed a bearish crossover on Saturday, further supporting the bearish outlook.
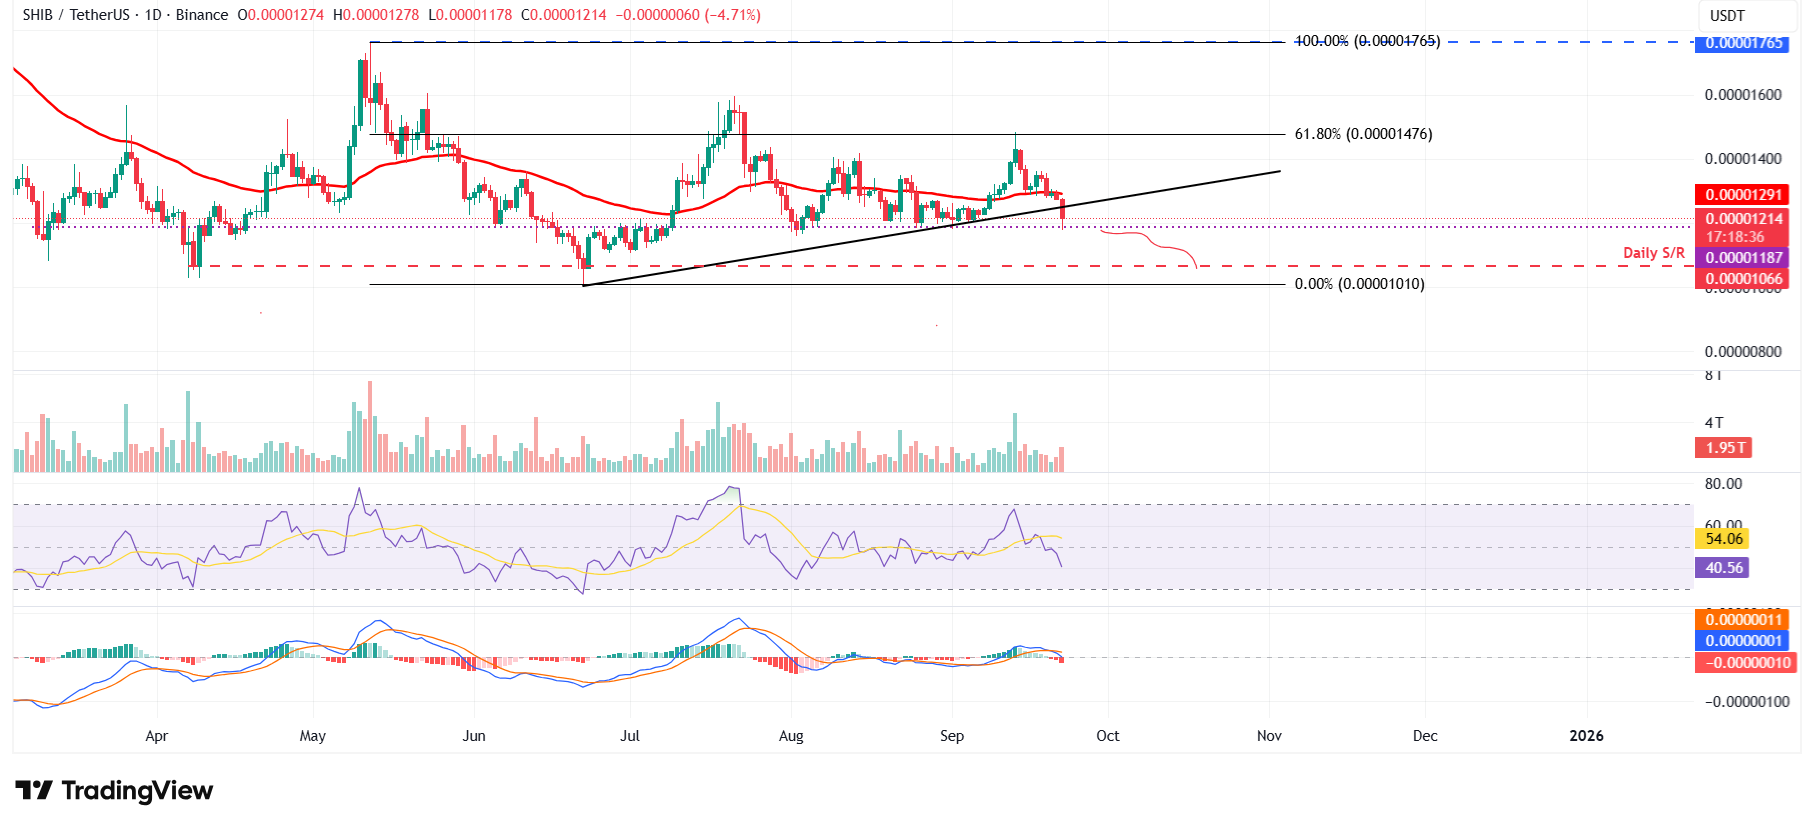
SHIB/USDT daily chart
On the other hand, if SHIB recovers, it could advance toward the 50-day EMA at $0.0000129.
Pepe Price Forecast: PEPE bears aiming for $0.0000079 mark
Pepe price closed below the 50-day EMA at $0.0000107 on Friday and declined 3.25% by Sunday. At the start of this week on Monday, it is losing by 6.72%, trading around $0.0000097.
If PEPE continues its downward trend, it could restest the daily support at $0.0000079.
Like DOGE and SHIB, PEPE’s RSI and MACD indicators signal weakening momentum, supporting the bearish view.
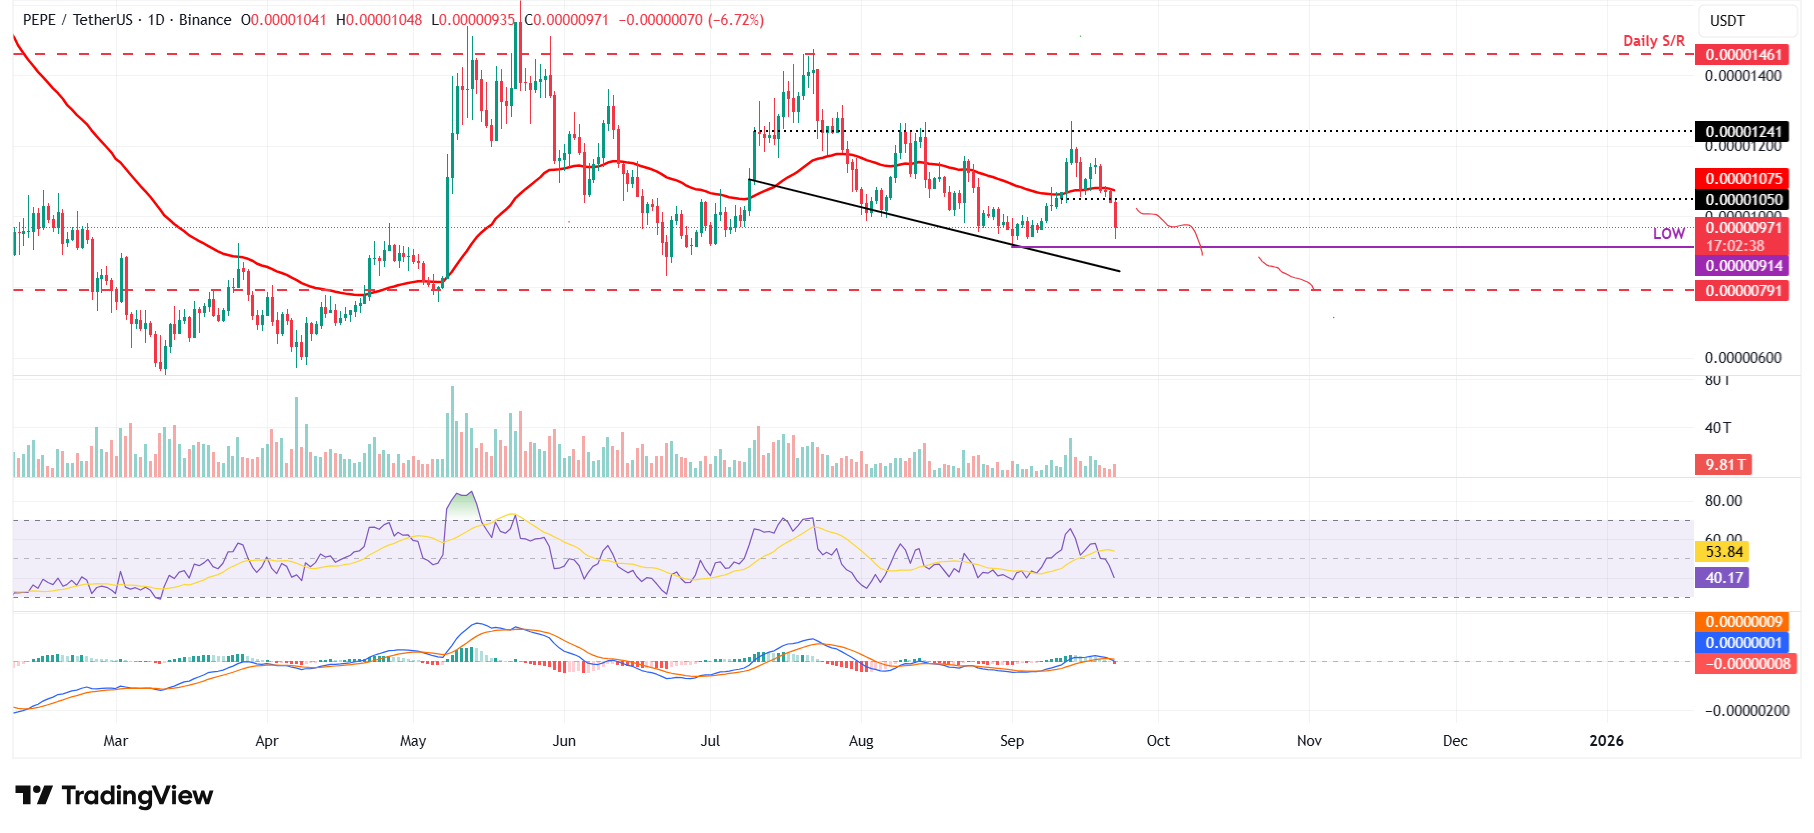
PEPE/USDT daily chart
However, if PEPE recovers, it could retest the 50-day EMA at $0.0000107.
Recommended Articles