

Meme Coins Price Prediction: Dogecoin, Shiba Inu, and Pepe edge down, setting up for the next rally

- Dogecoin price dips on Monday after rallying nearly 22% the previous week.
- Shiba Inu price trades within a symmetrical triangle pattern, a potential breakout could signal significant gains ahead.
- Pepe price holds gains after breaking above a falling wedge pattern, signaling a bullish rally on the horizon.
Dogecoin (DOGE), Shiba Inu (SHIB), and Pepe (PEPE) meme coins experienced a price correction on Monday, following gains of nearly 22%, 10%, and 17%, respectively, in the previous week. These top meme coins are nearing key support levels and offering traders a potential buy-the-dip opportunity before the next leg higher.
Dogecoin Price Forecast: Bulls aiming for $0.311 mark
Dogecoin price broke above the symmetrical triangle pattern on September 8 (formed by connecting multiple highs and lows with two trendlines since mid-July), and rose 20% in the next five days. However, DOGE corrected nearly 4% on Sunday. At the time of writing on Monday, it trades down around $0.269.
Sideline investors looking to accumulate DOGE could do so at $0.256, which is the daily support level.
If DOGE rebounds from this daily support at $0.256, it could extend the rally toward the next daily resistance level at $0.311.
The Relative Strength Index (RSI) currently reads 63 on the daily chart, having faced rejection from its overbought level of 70 during the weekend and now points downward, indicating a fading of bullish momentum. However, the RSI is still above its neutral level of 50, suggesting bulls still have room for an upward swing. Moreover, the Moving Average Convergence Divergence (MACD) exhibited a bullish crossover last week, which remains in effect, and also displays rising green histogram bars above its neutral level, indicating bullish momentum and the continuation of an upward trend.
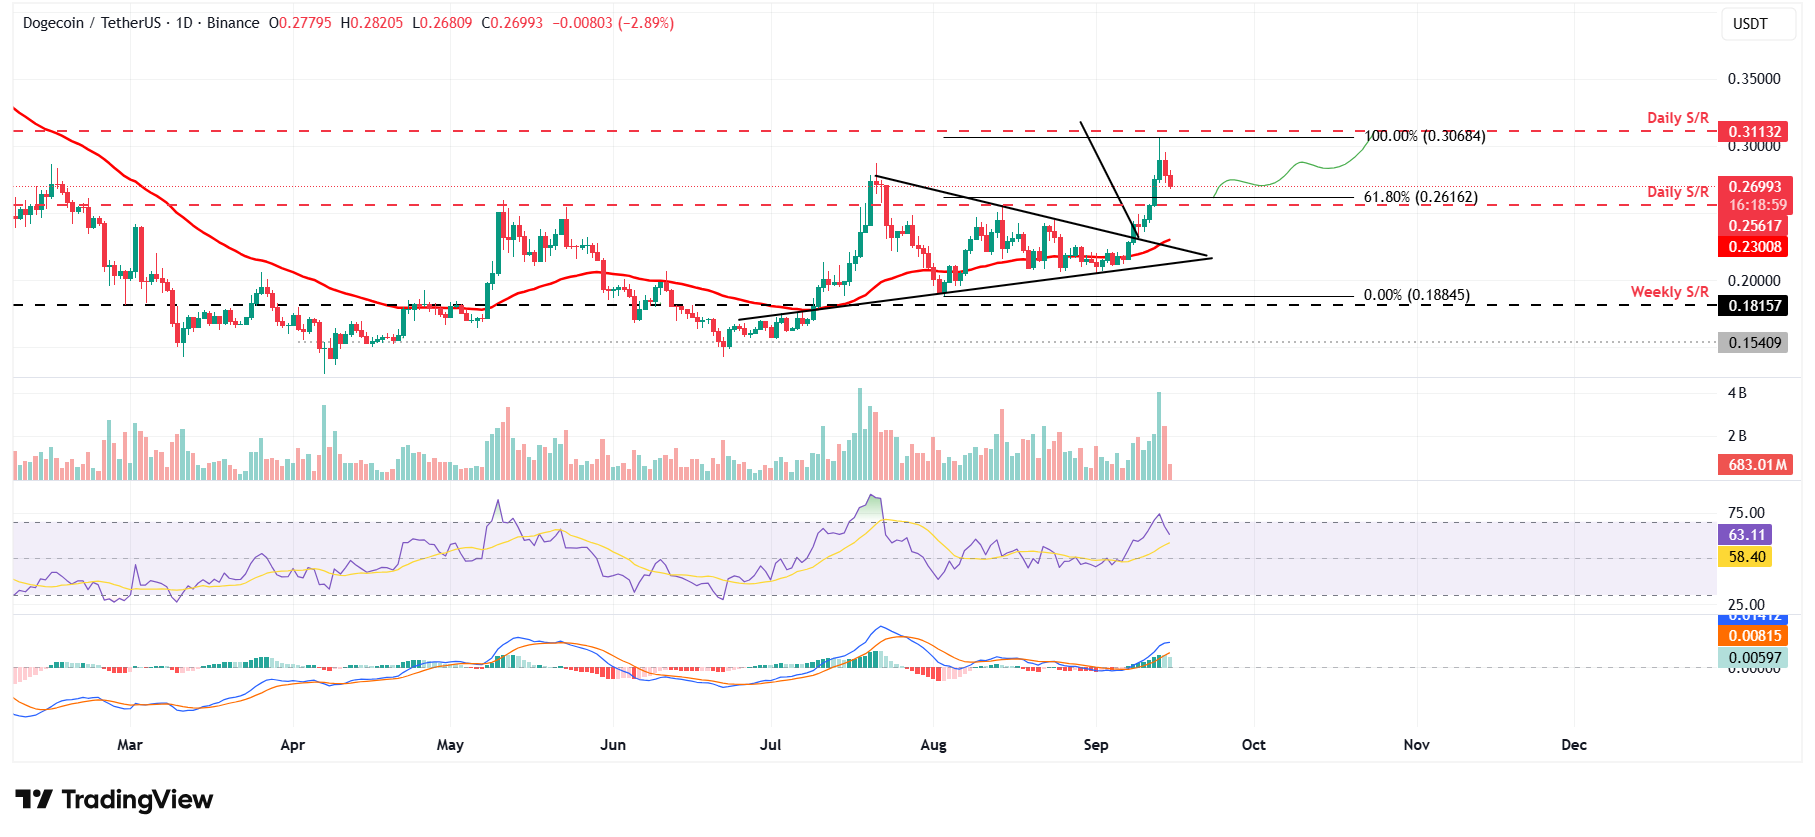
DOGE/USDT daily chart
However, if Dogecoin faces a correction, it could extend the decline toward the 61.8% Fibonacci retracement level at $0.261 (drawn from the August 3 low of $0.188 to September 13 high of $0.306).
Apart from the bullish technicals, Santiment data shows that the DOGE ecosystem’s trading volume reached $9.02 billion on Saturday, the highest level since early Feburary. This volume rise indicates a surge in traders’ interest and liquidity in the DOGE chain, boosting its bullish outlook.
 [13-1757926683936-1757926683937.03.50, 15 Sep, 2025].png)
DOGE trading volume chart. Source: Santiment
Shiba Inu Price Forecast: SHIB could rally if it breaks above the bullish pattern
Shiba Inu price closed above the 50-day Exponential Moving Average (EMA) on September 8, found support around it and rallied 12% until Saturday. However, it was rejected after retesting the upper trendline of the symmetrical triangle and declined by 4.27% on Sunday. At the time of writing on Monday, it extends its decline, trading around $0.0000133.
If SHIB finds support around the 50-day EMA at $0.0000129, it would first rally toward its 61.8% Fibonacci retracement level at $0.0000147 (drawn from the May high of $0.0000176 to the June low of $0.0000100). A successful close above this level extends gains toward its May 12 high at $0.0000176.
Like Dogecoin, SHIB’s RSI at 54 also indicates a fading of bullish momentum on the daily chart. However, the RSI is still above its neutral level of 50, suggesting bulls still have room for an upward swing. Similarly, the SHIB’s MACD also supports the bullish view like Dogecoin, with a buy signal still in effect.
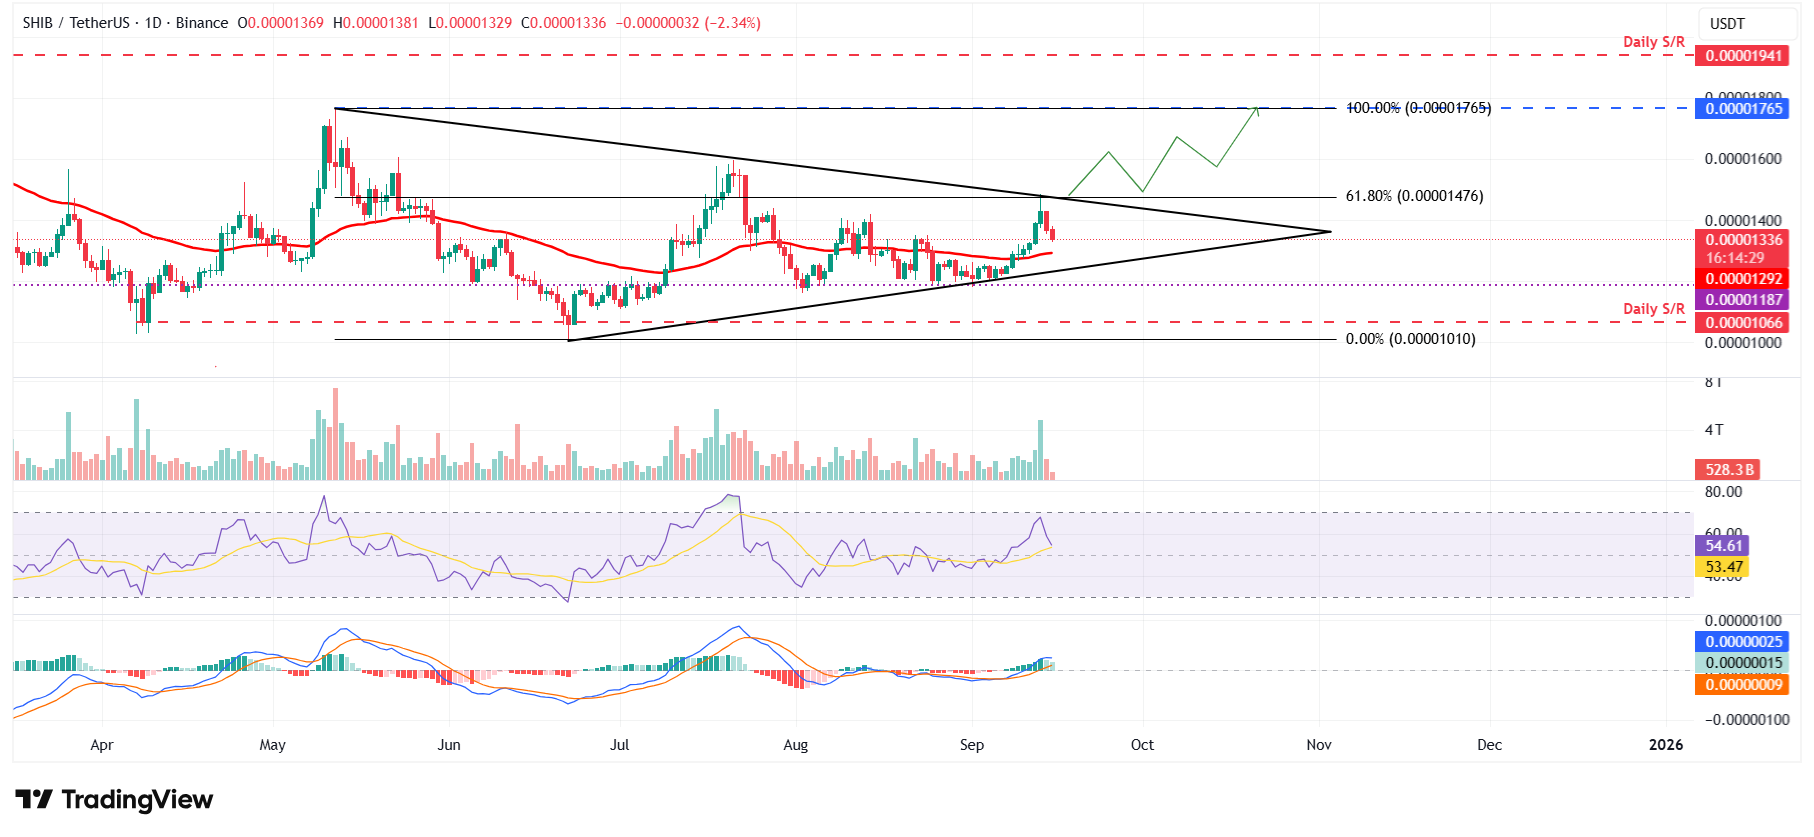
SHIB/USDT daily chart
However, if SHIB closes below the 50-day EMA at $0.0000129, it could extend the decline toward its daily support at $0.0000118.
Coinglass long-to-short ratio for SHIB read 1.11 on Monday, the highest level in over a month. This ratio, above one, reflects bullish sentiment in the markets, as more traders are betting on the SHIB price to rise.
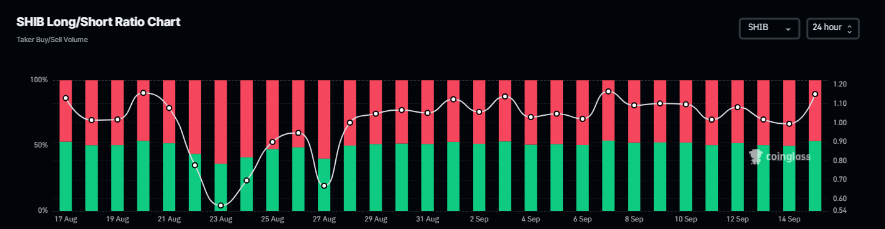
SHIB long-to-short ratio chart. Source: Coinglass
Pepe Price Forecast: Breaks out of the falling wedge pattern
Pepe price broke out of the falling wedge pattern (drawn by connecting multiple highs and lows with two trendlines) on Thursday and rallied over 11% in the next two days. However, it was rejected after retesting the daily resistance level at $0.0000124 and declined 3.11% on Sunday. At the time of writing on Monday, it continues to trade down at around $0.0000108.
Sideline investors looking to accumulate PEPE could do so between $0.0000107 and $0.0000105, before a second leg higher.
If PEPE finds support around the above-mentioned support levels, it could extend the rally toward the daily resistance at $0.0000124. A successful close above this level could lead to more gains toward its next daily resistance at $0.0000146.
Like Dogecoin and Shiba Inu, PEPE RSI and MACD indicators on the daily chart also support the bullish view.
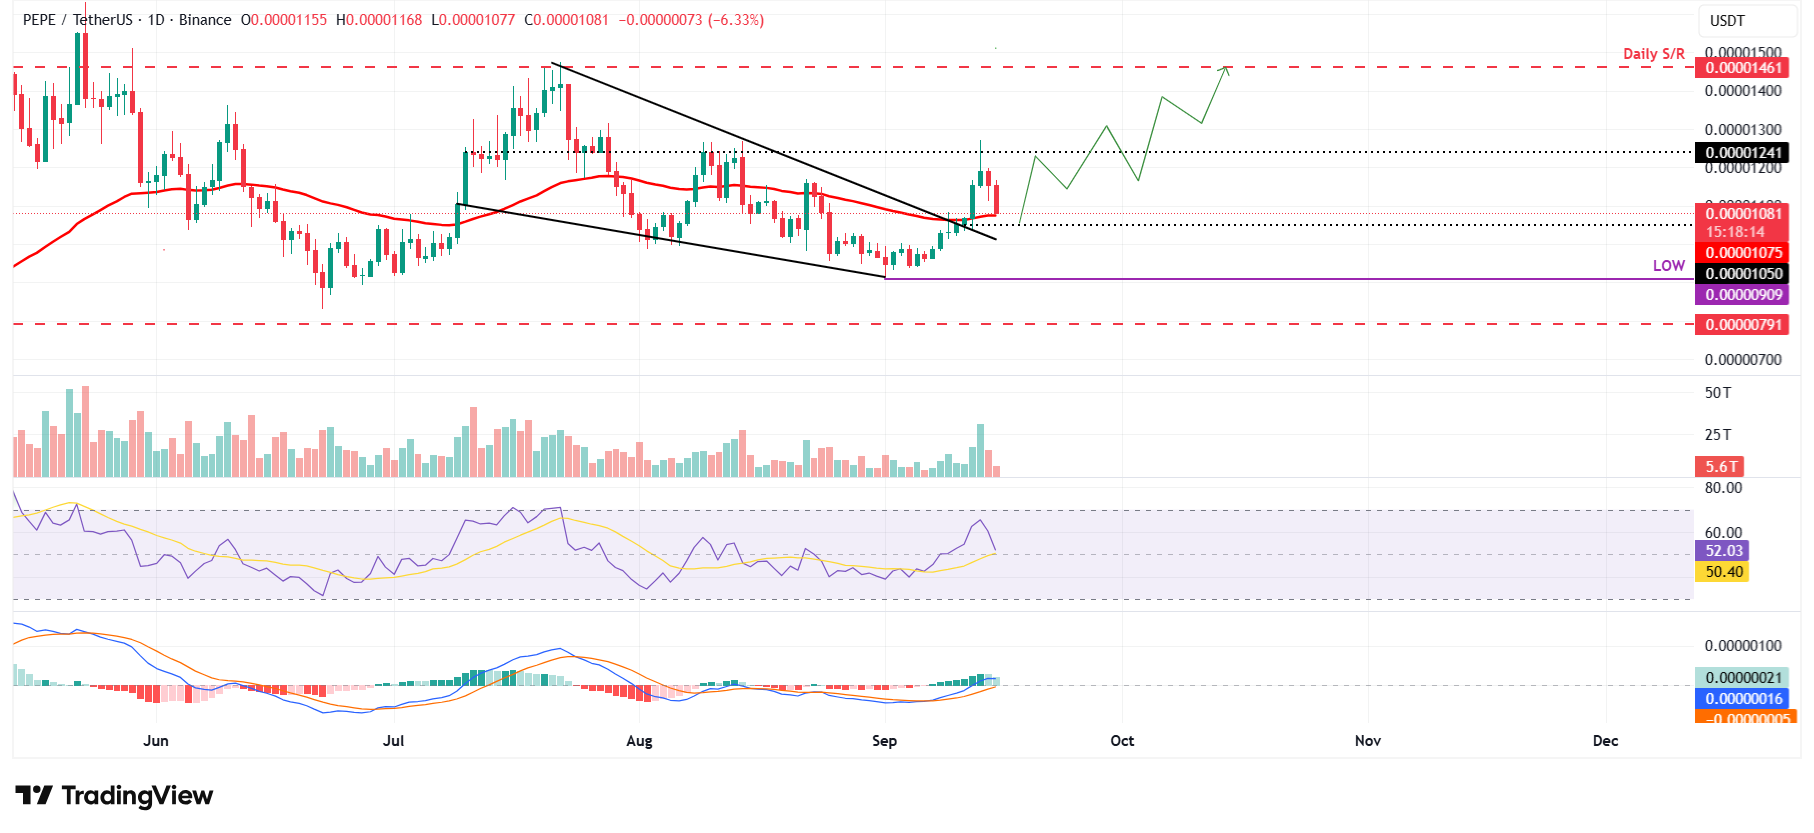
PEPE/USDT daily chart
However, if PEPE closes below the daily support at $0.0000105, it could extend the decline toward its September 1 low at $0.0000090.
Related Articles
Amazon Stock Predictions for 2026 to 2030: Will They Exceed Expectations and Achieve Major Long-Term Goals?
TradingKey - As we head into 2026, many investors are questioning where Amazon (AMZN) fits into the technology world.
A Crash After a Surge: Why Silver Lost 40% in a Week?
TradingKey - Spot silver (XAGUSD) prices continue to decline. Silver plunged 20% on Thursday, breaking below $71 per ounce, with the sell-off intensifying on Friday as prices fell further below $64. Compared to the all-time high set on January 29, silver prices have retraced more than 40%, wiping out nearly all gains accumulated over the previous month.
Google Cloud Revenue Surges 48% in Q4 as CapEx Guidance Nearly Doubles: Why the 7.5% After-Hours Dip?
TradingKey - After the close on February 4 (ET), Google (GOOG, GOOGL) released stellar Q4 results: total revenue grew 18% year-over-year, hitting a new quarterly record after revenue first surpassed $100 billion in Q3. The primary highlight was Google Cloud, where Q4 revenue surged 48% year-over-yea
Is Bitcoin’s Four-Year Cycle Dead in 2026?
Is the Bitcoin 4-year cycle dead? After 2025 broke historical records with a red post-halving year, institutional analysts explore if the Bitcoin price has decoupled from the halving countdown. Analyze the impact of spot ETFs, global liquidity, and the roadmap to the 2028 halving in this 2026 market

