

Cardano Price Forecast: ADA gears up for a potential breakout run

- Cardano edges higher within a falling wedge pattern, with bulls targeting a breakout rally.
- Optimism remains steady among Cardano derivative traders.
- On-chain data shows declining profit booking and active addresses.
Cardano (ADA) trades above $0.80 at press time on Friday, with bulls trying to overcome the 3.26% loss from the previous day. Cardano’s recovery teases a potential falling wedge pattern breakout on the 4-hour chart amid steady optimism among derivative traders. However, the on-chain data flash weakness as profits and network activity decline.
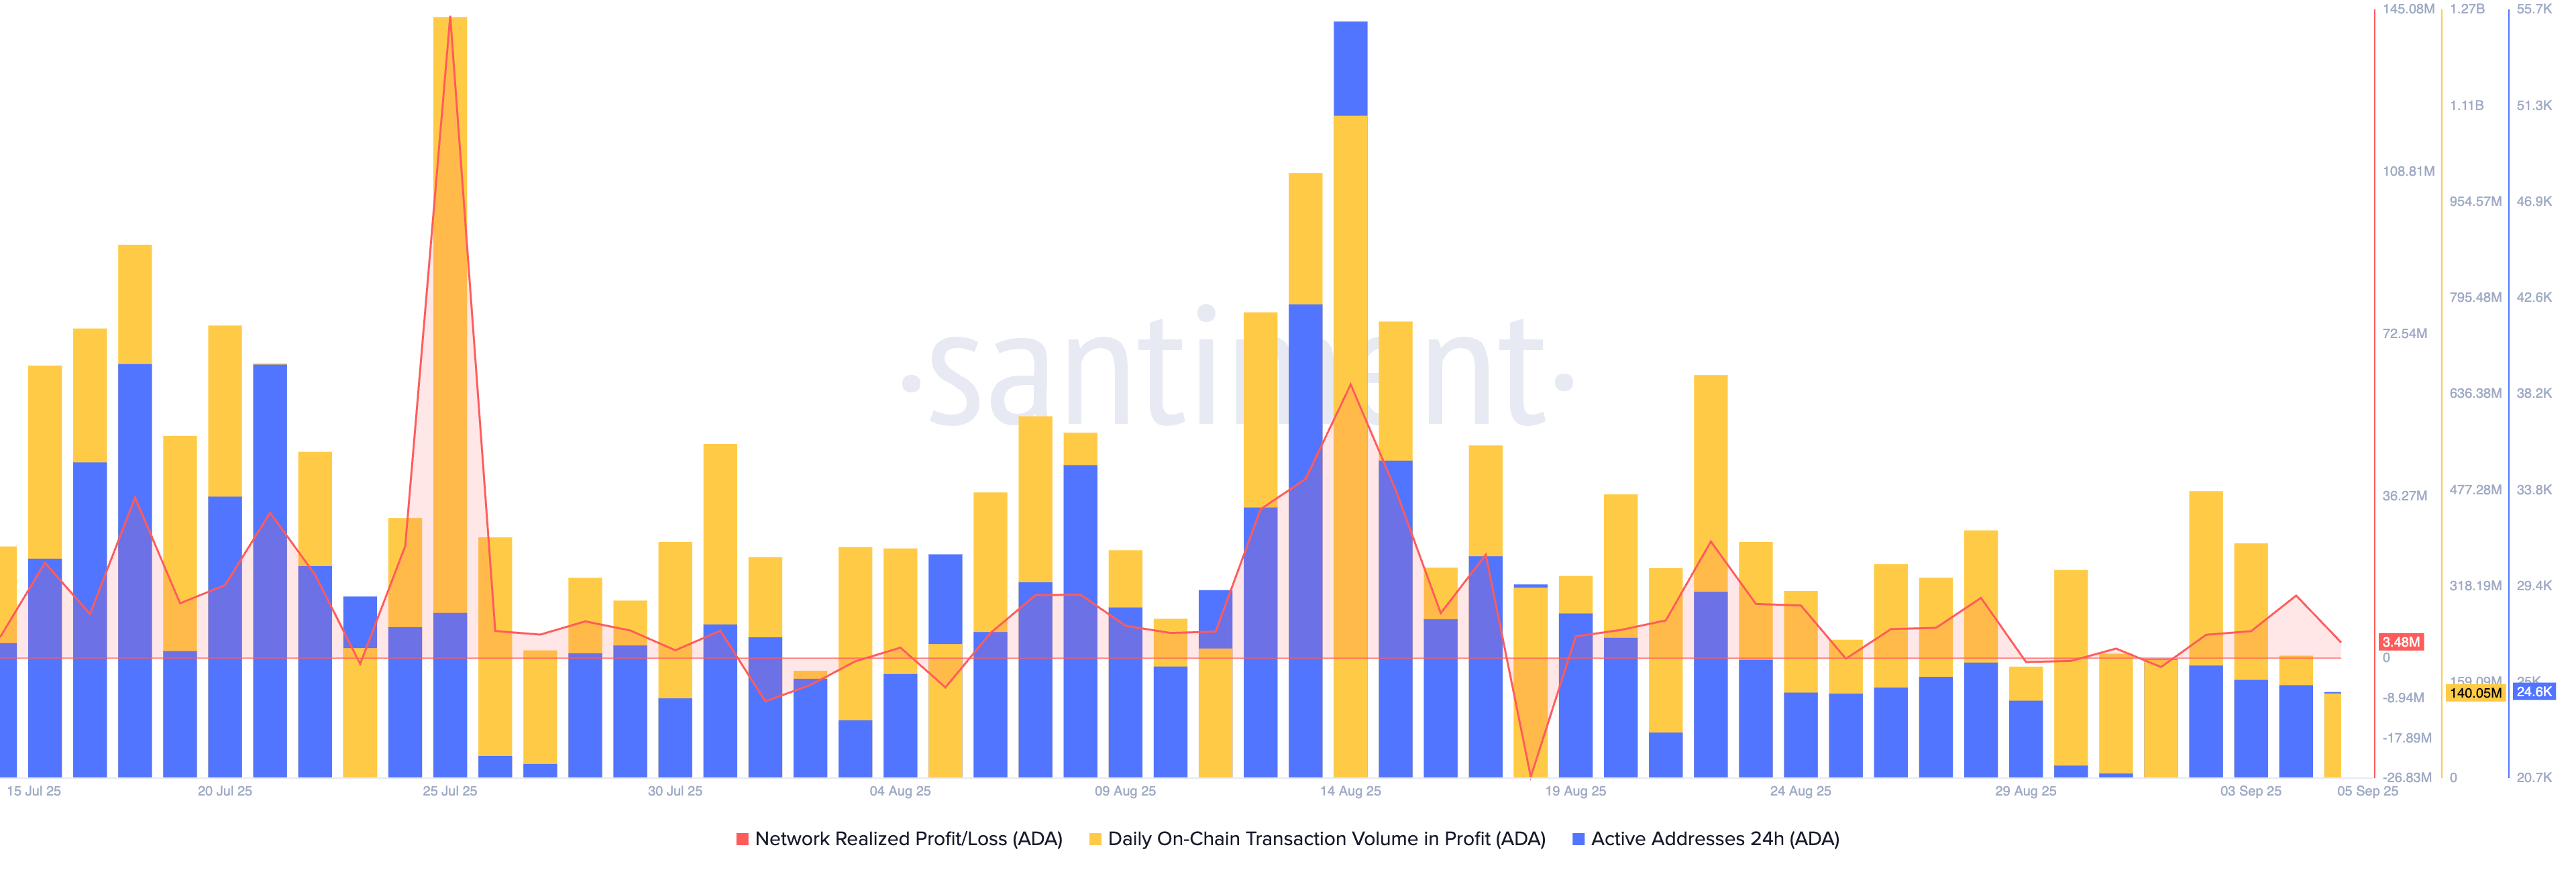
On-chain data reveals underlying weakness
The Network Realized Profit/Loss (NRPL) is used to gauge the net amount of profit or loss realized by token holders after on-chain transactions. Santiment data shows Cardano’s NRPL stands at 3.48 million ADA, down from 13.98 million ADA on Thursday. This indicates a significant decline in the amount of profits booked by ADA holders, suggesting a drop in bullish momentum.
Additionally, the number of active addresses on Cardano dropped to 24,455 on Friday, from 24,955 the previous day, indicating a decline in network activity. Cardano stands on thin ice as on-chain data points to fading bullish momentum and network activity.
Cardano nears a falling wedge pattern breakout
Cardano edges higher by over 2% on the day, challenging an overhead resistance trendline on the 4-hour chart, formed by connecting the highs of August 14 and August 25. This trendline completes a falling wedge pattern with a support trendline connected by the August 20 and September 1 lows.
If Cardano marks a decisive close above the 200-period Exponential Moving Average (EMA) at $0.8335, it would confirm the falling wedge pattern breakout. The breakout rally in Cardano could target the R1 pivot level at $0.8913.
Adding to the optimism, Cardano’s Open Interest (OI) holds above $1.570 billion, following the surge in mid-August. This indicates steady optimism among derivative traders.
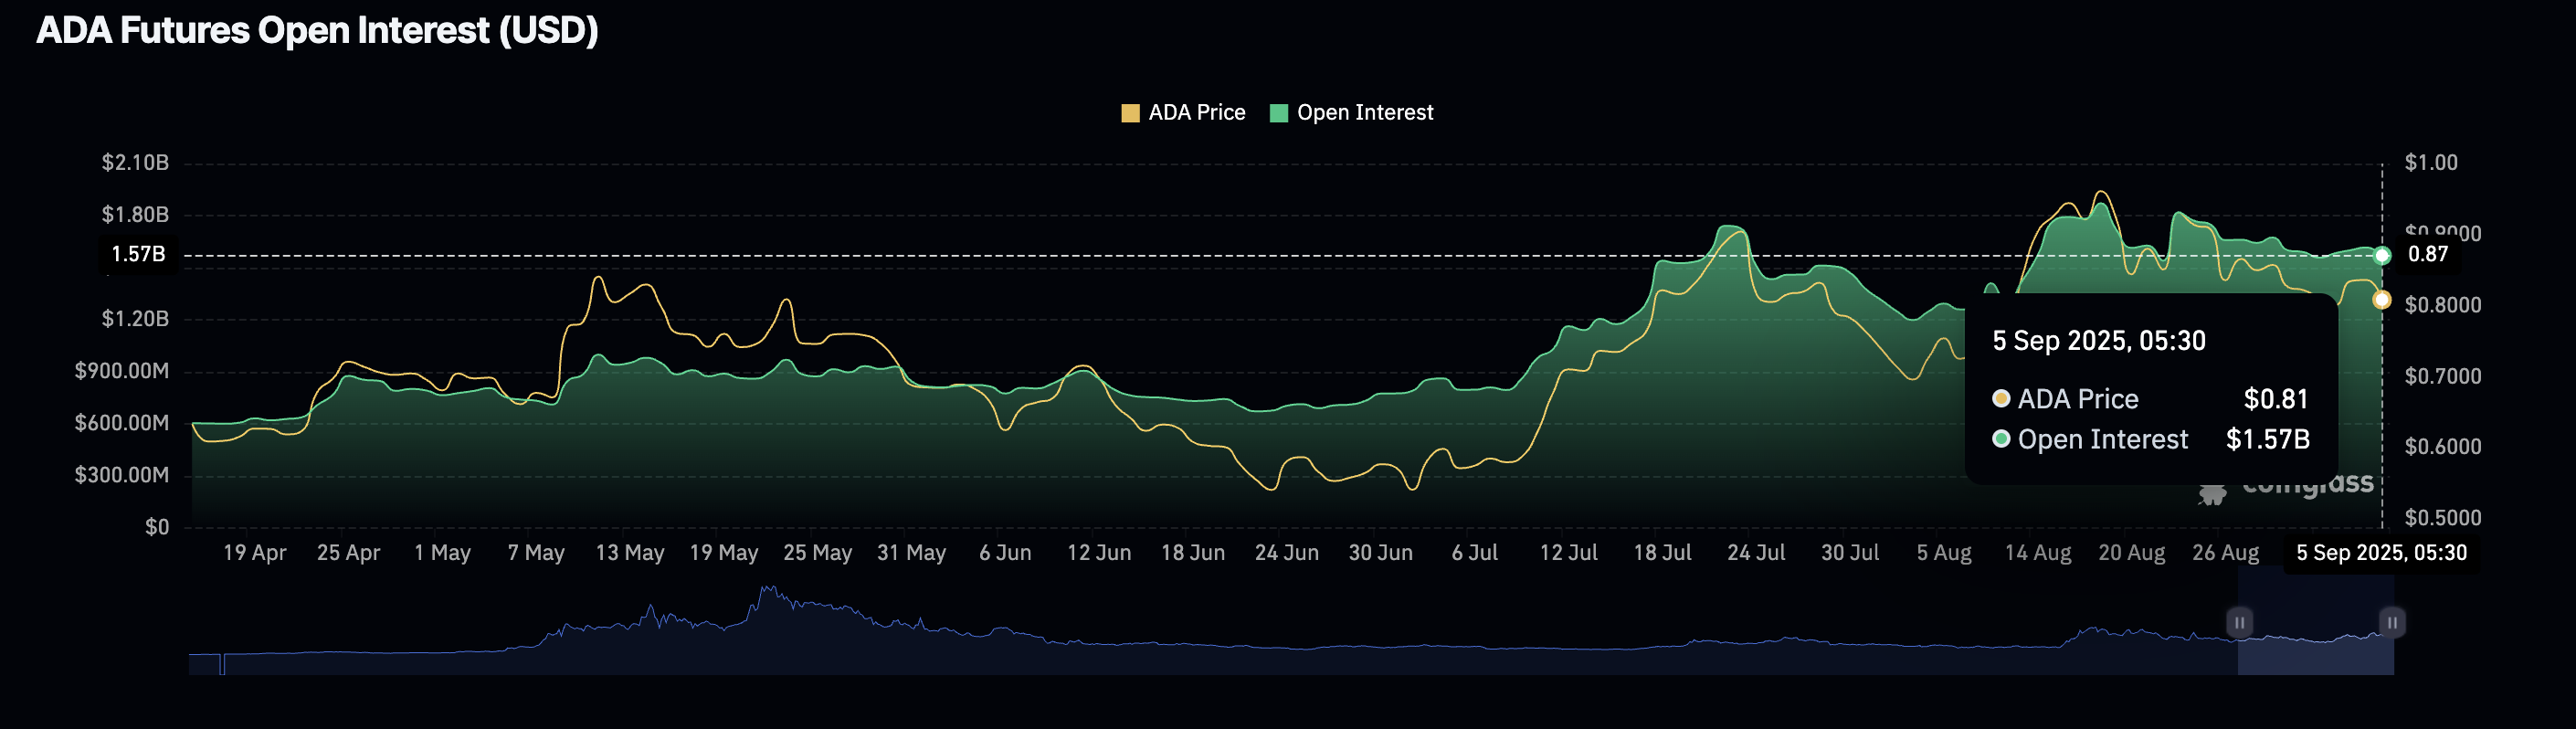
ADA Open Interest. Source: Coinglass
However, the technical indicators on the 4-hour chart flash mixed signals after the chaotic decline over the past few days. The Moving Average Convergence Divergence (MACD) approaches its signal line for a crossover, which would indicate a bullish shift, just a day after a bearish turnaround on Thursday.
The Relative Strength Index (RSI) reads 52 on the same chart, surfacing above the halfway mark, which indicates a rise in buying pressure. Even so, the 50-period EMA shows a declining trend and has crossed under the 200-period EMA, signaling a Death Cross pattern.
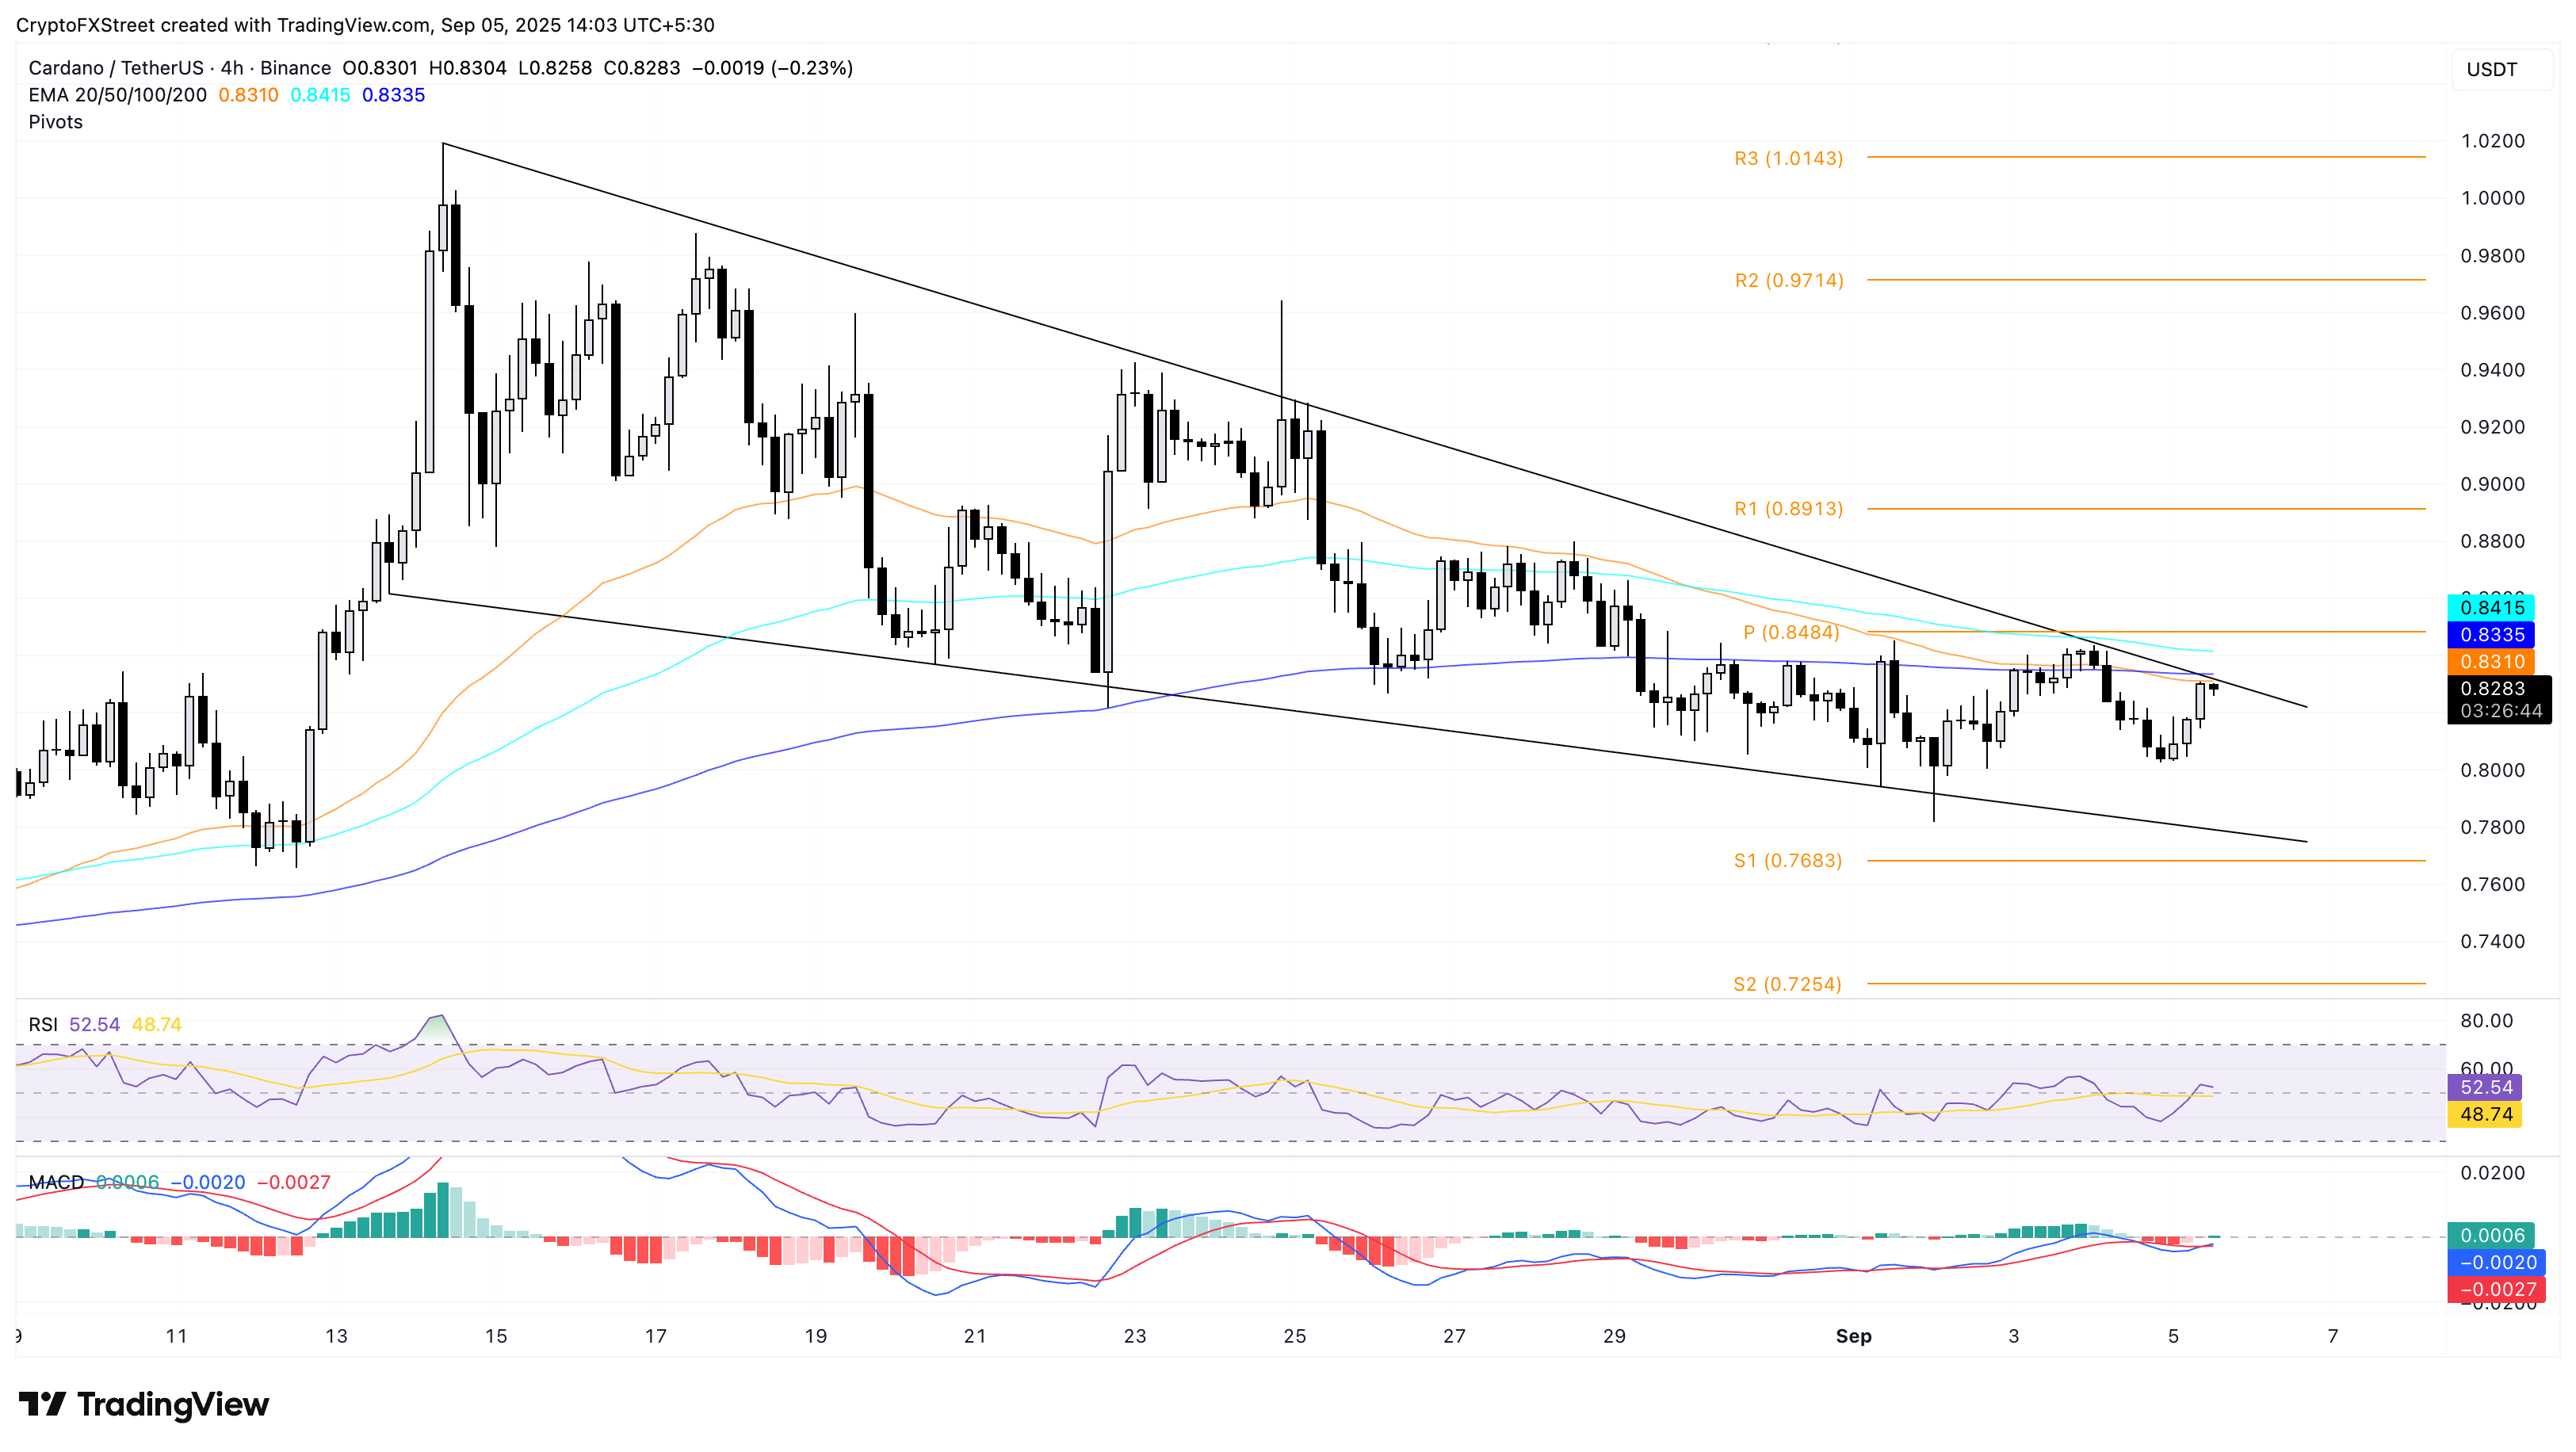
Looking down, a reversal from the 200-period EMA could result in a renewed downcycle within the falling wedge pattern. If so, ADA could extend the decline to the lower support trendline near $0.7788.
Related Articles
Amazon Stock Predictions for 2026 to 2030: Will They Exceed Expectations and Achieve Major Long-Term Goals?
TradingKey - As we head into 2026, many investors are questioning where Amazon (AMZN) fits into the technology world.
A Crash After a Surge: Why Silver Lost 40% in a Week?
TradingKey - Spot silver (XAGUSD) prices continue to decline. Silver plunged 20% on Thursday, breaking below $71 per ounce, with the sell-off intensifying on Friday as prices fell further below $64. Compared to the all-time high set on January 29, silver prices have retraced more than 40%, wiping out nearly all gains accumulated over the previous month.
Is Bitcoin’s Four-Year Cycle Dead in 2026?
Is the Bitcoin 4-year cycle dead? After 2025 broke historical records with a red post-halving year, institutional analysts explore if the Bitcoin price has decoupled from the halving countdown. Analyze the impact of spot ETFs, global liquidity, and the roadmap to the 2028 halving in this 2026 market
USD Dollar Trend Forecast: Dollar Index Falls Below 97.0 to 4-Year Low, Will the Dollar Continue To Fall or Bottom Out in 2026?
TradingKey - In January 2026, the US Dollar Index continued its downward trend from 2025, officially breaking below the key 97.0 level and reaching a low of 95.5, marking a nearly four-year low since February 2022.

