Crypto market liquidations surge to $935M as Fartcoin, OKB, and CRV plunge

- Fartcoin depreciates by over 16% below its 200-day EMA, risking a crucial support breakdown.
- OKB hits a key support at the lower boundary of a declining wedge pattern.
- Curve DAO token risks falling out of a declining channel pattern.
Fartcoin (FARTCOIN), OKB (OKB), and Curve DAO (CRV) emerge as frontrunners in the declining market trend, with double-digit losses over the last 24 hours.
The cryptocurrency market has incurred $935.44 million in liquidations over the last 24 hours, as Bitcoin (BTC) drops below $110,000 and Ethereum (ETH) slipped below $4,500 on Monday. This pullback extends the weakness from Sunday, resulting in a larger wipeout of retail leverage in the derivatives market.
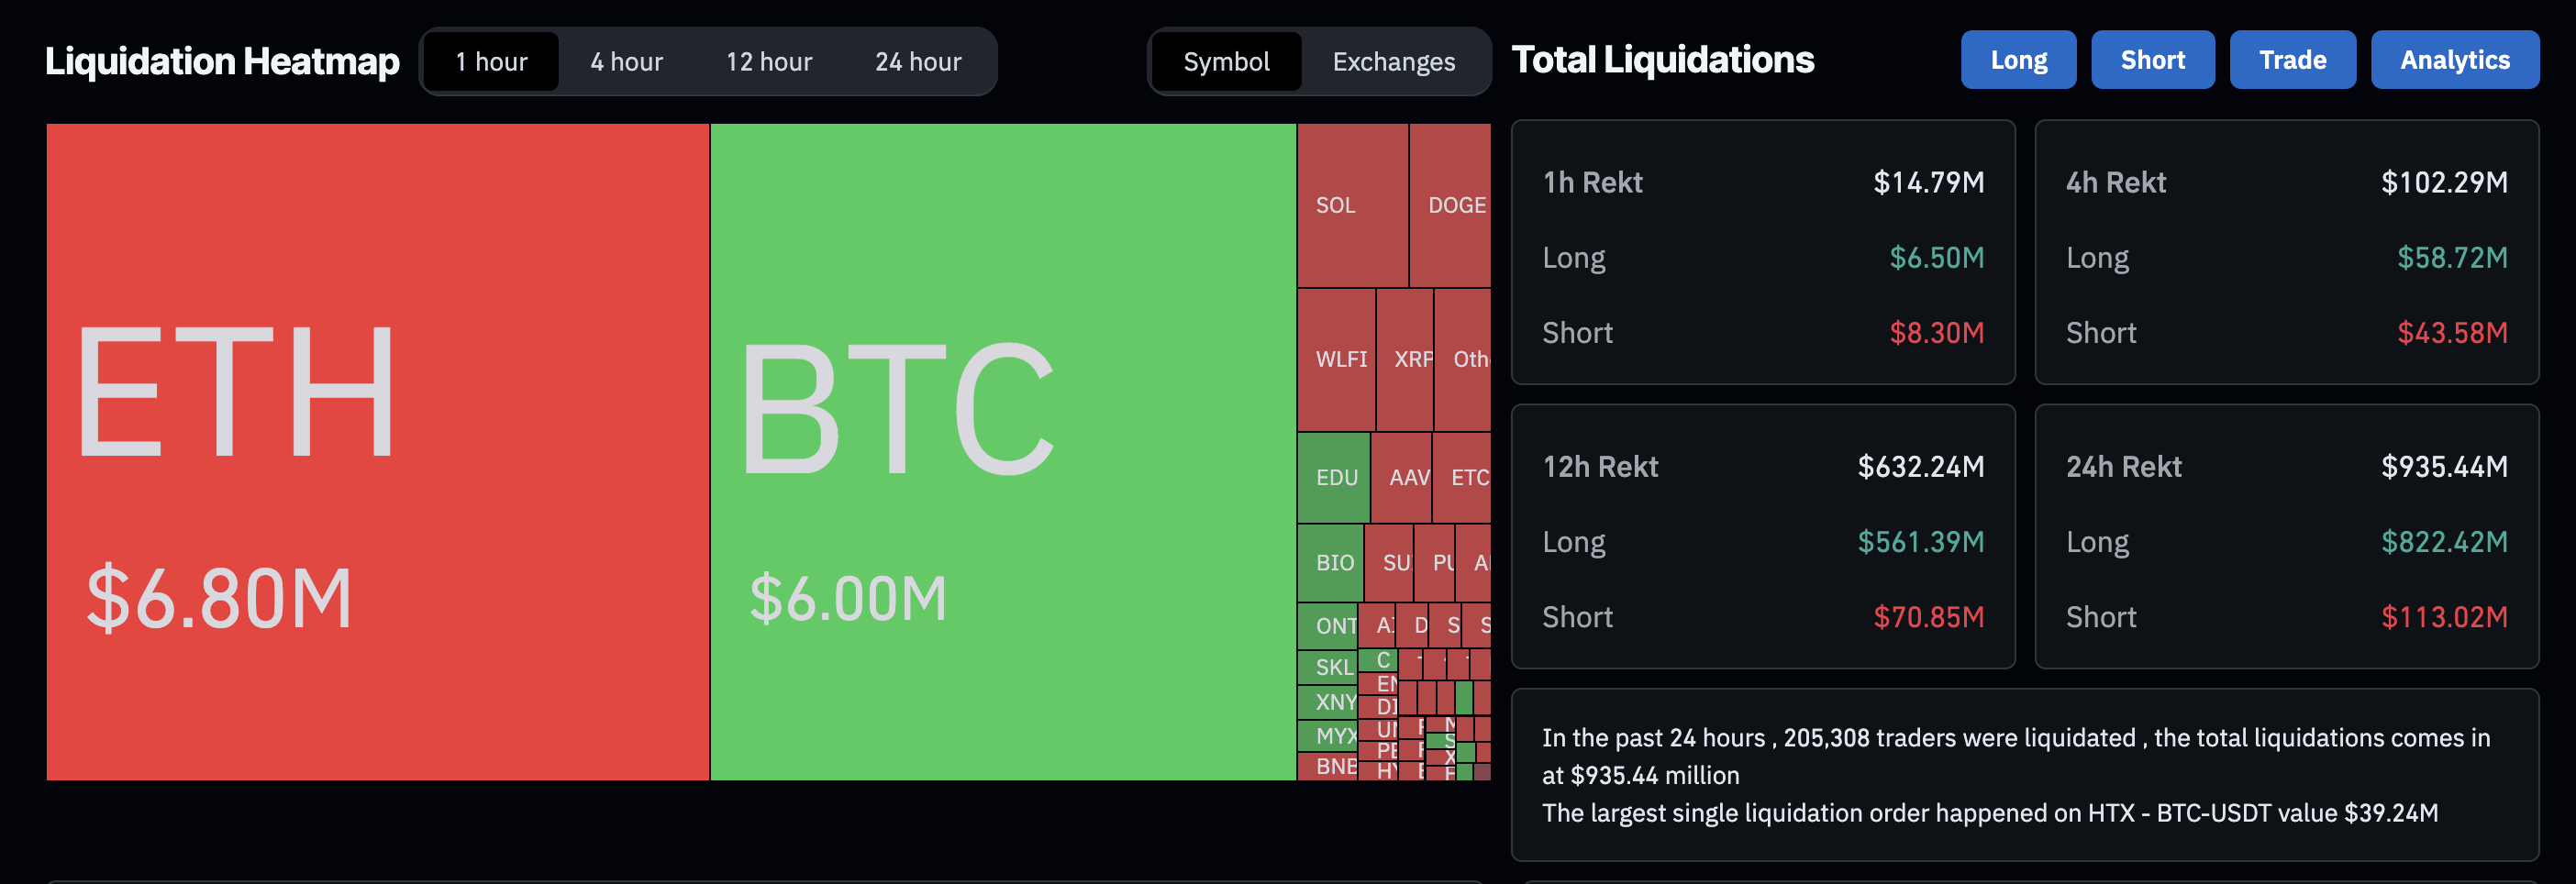
Total Liquidations. Source: Coinglass
Out of the $935.44 million liquidations, $822.42 million in long liquidations outpace the $113.02 million of short liquidations, indicating a larger bullish wipeout. Amid the wipeout, the crypto market Open Interest has declined by 6.98% to $202.42 billion, from $217.61 billion on Monday.
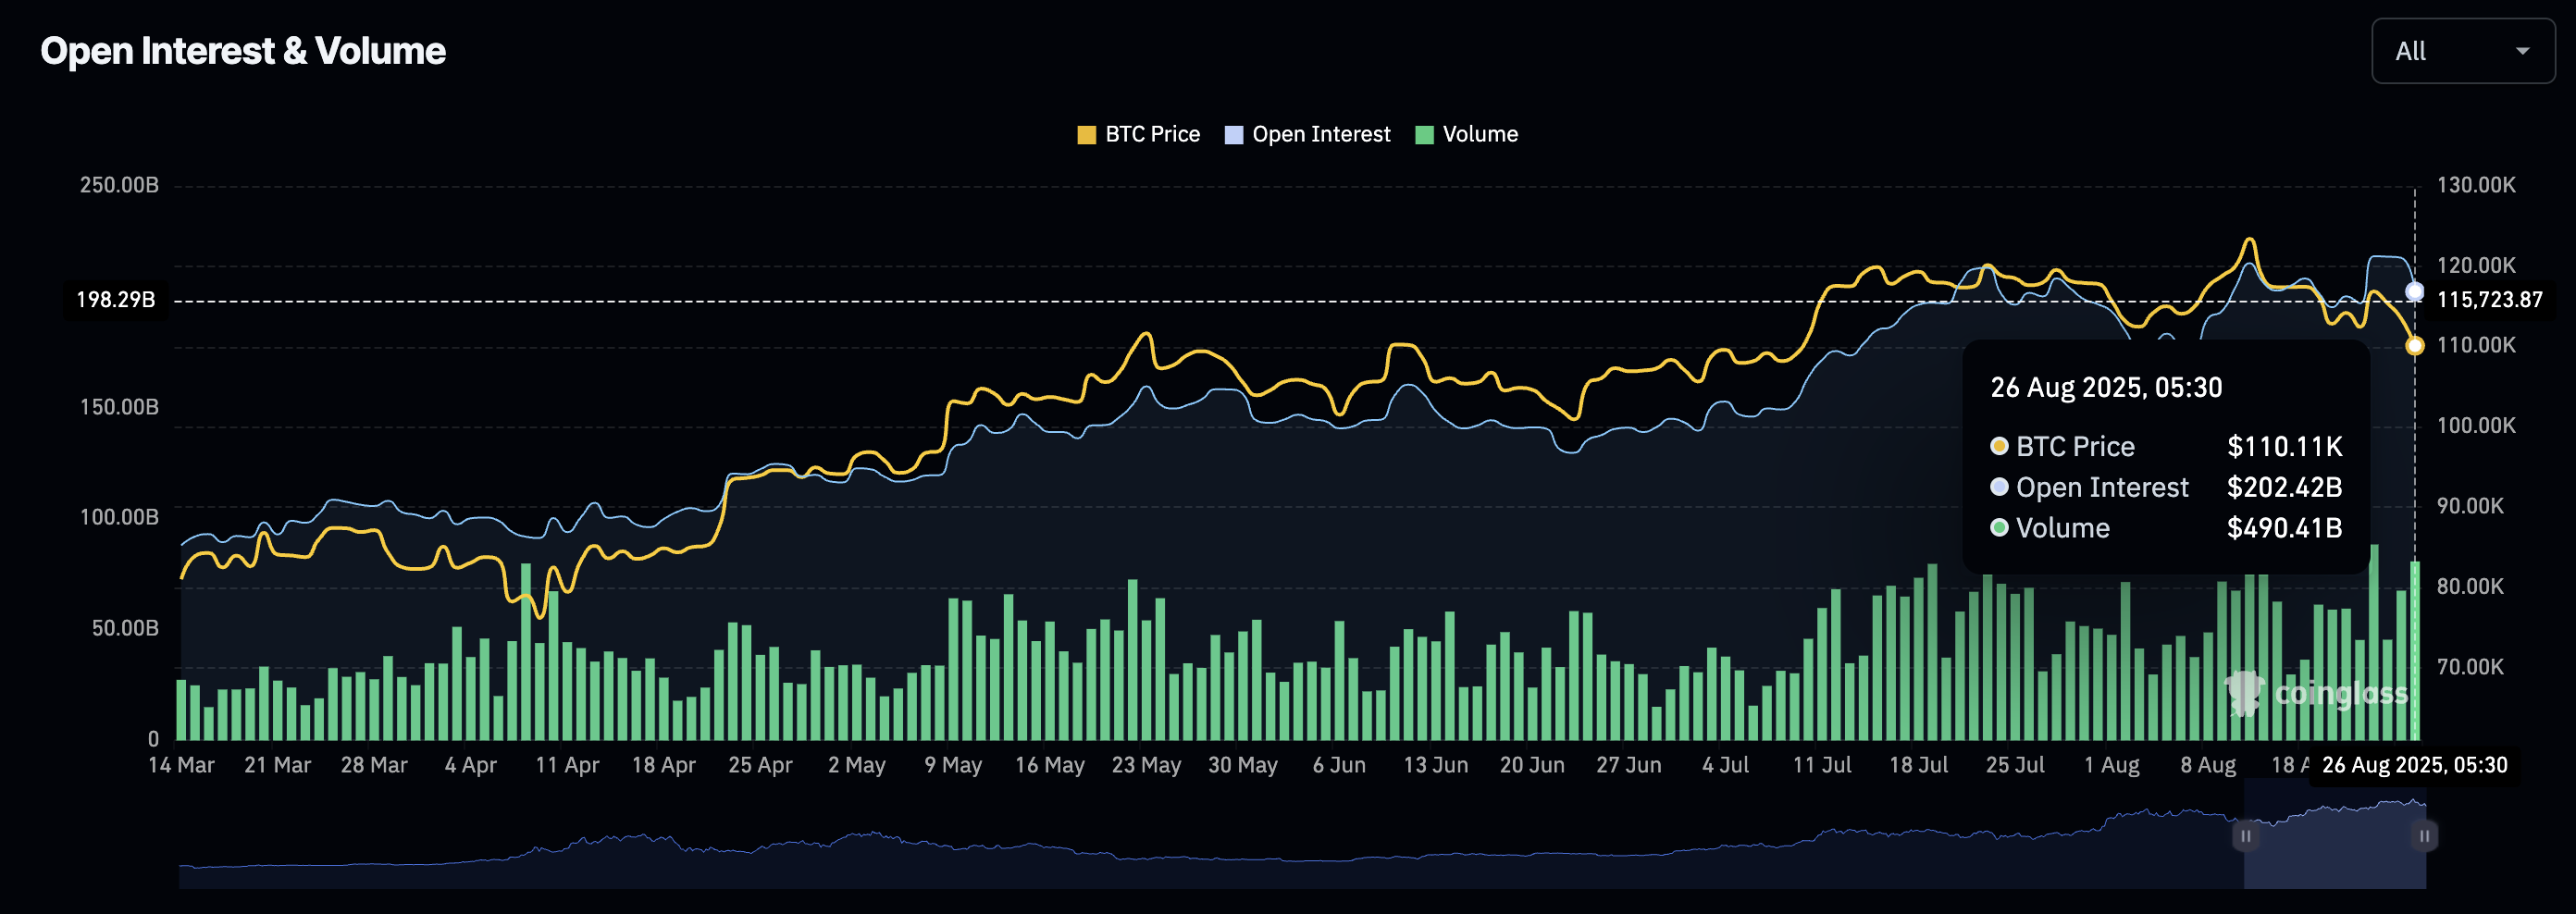
Open Interest. Source: Coinglass
The massive outflow from the broader crypto market highlights a shift in momentum ahead of September, which is a historically weaker month for Bitcoin.
Fartcoin’s declines reaches a crucial support level
Fartcoin trades at $0.7856 at press time on Tuesday, holding above the 50% retracement level at $0.7378, which is drawn between $2.74 on January 19 and $0.1986 on March 10. The 16.85% reversal from the 200-day Exponential Moving Average (EMA) on Monday puts this 50% retracement support at risk.
If Fartcoin extends the downtrend, a decisive close below this support could test the $0.5730 support, which previously acted as a resistance on April 8.
The Relative Strength Index (RSI) reads 38 on the daily chart, slipping below the halfway line, which indicates a lowered buying pressure. If the RSI slips to the oversold region, Fartcoin could drop below the crucial support threshold.
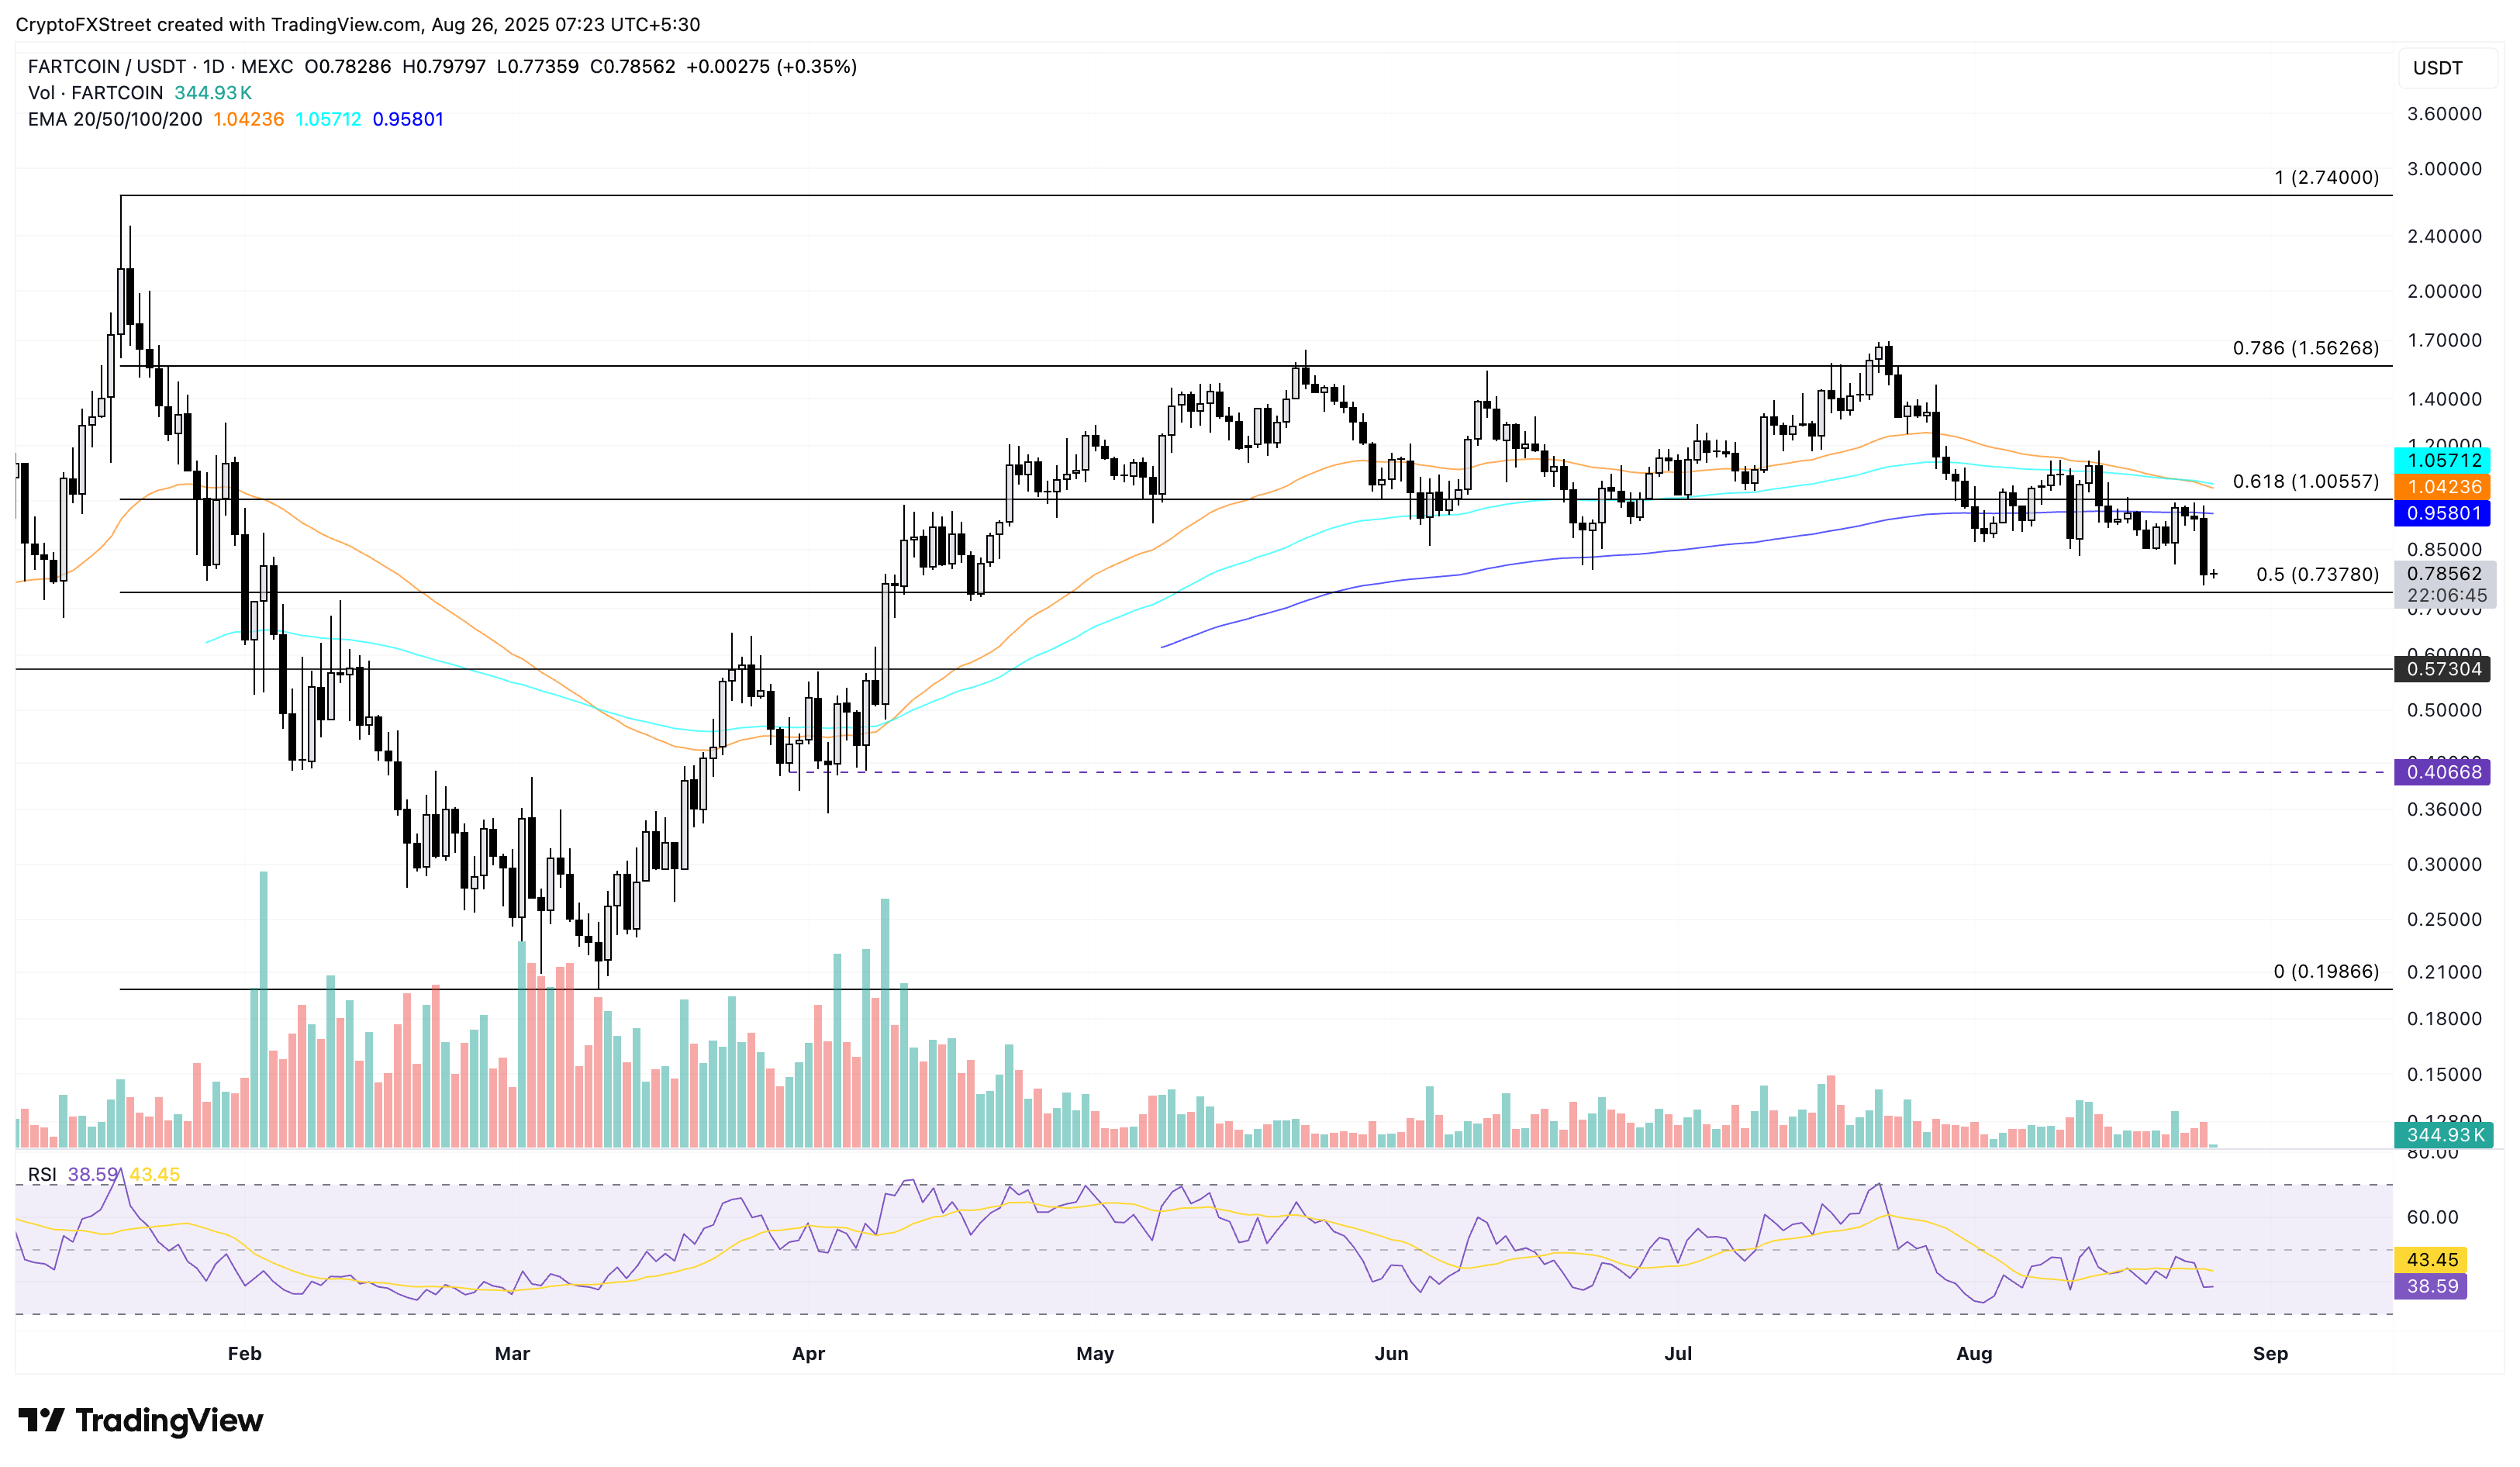
FARTCOIN/USDT daily price chart.
On the contrary, a potential reversal from the $0.7378 level, similar to the April 19 reversal, could result in a bounce back to the $1.0000 psychological level.
OKB could take a bearish exit out of a falling wedge pattern
The brilliant performance of OKB last week, driven by the 65 million token burn, takes a hit as the broader crypto market corrects. At the time of writing, OKB trades at $171 near the 50-period EMA, which aligns with the falling wedge pattern’s lower support trendline on the daily chart (shared below).
If OKB drops below this support trendline near $165, a decisive close will signal the breakdown of the pattern. This could extend the downtrend to the $142 support, marked by the August 13 high.
The RSI on the same chart has dropped to 39, which indicates a bearish shift in trend. Additionally, the Moving Average Convergence Divergence (MACD) crosses below the zero line with its signal line mirroring the fall, which suggests a rise in bearish trend momentum.
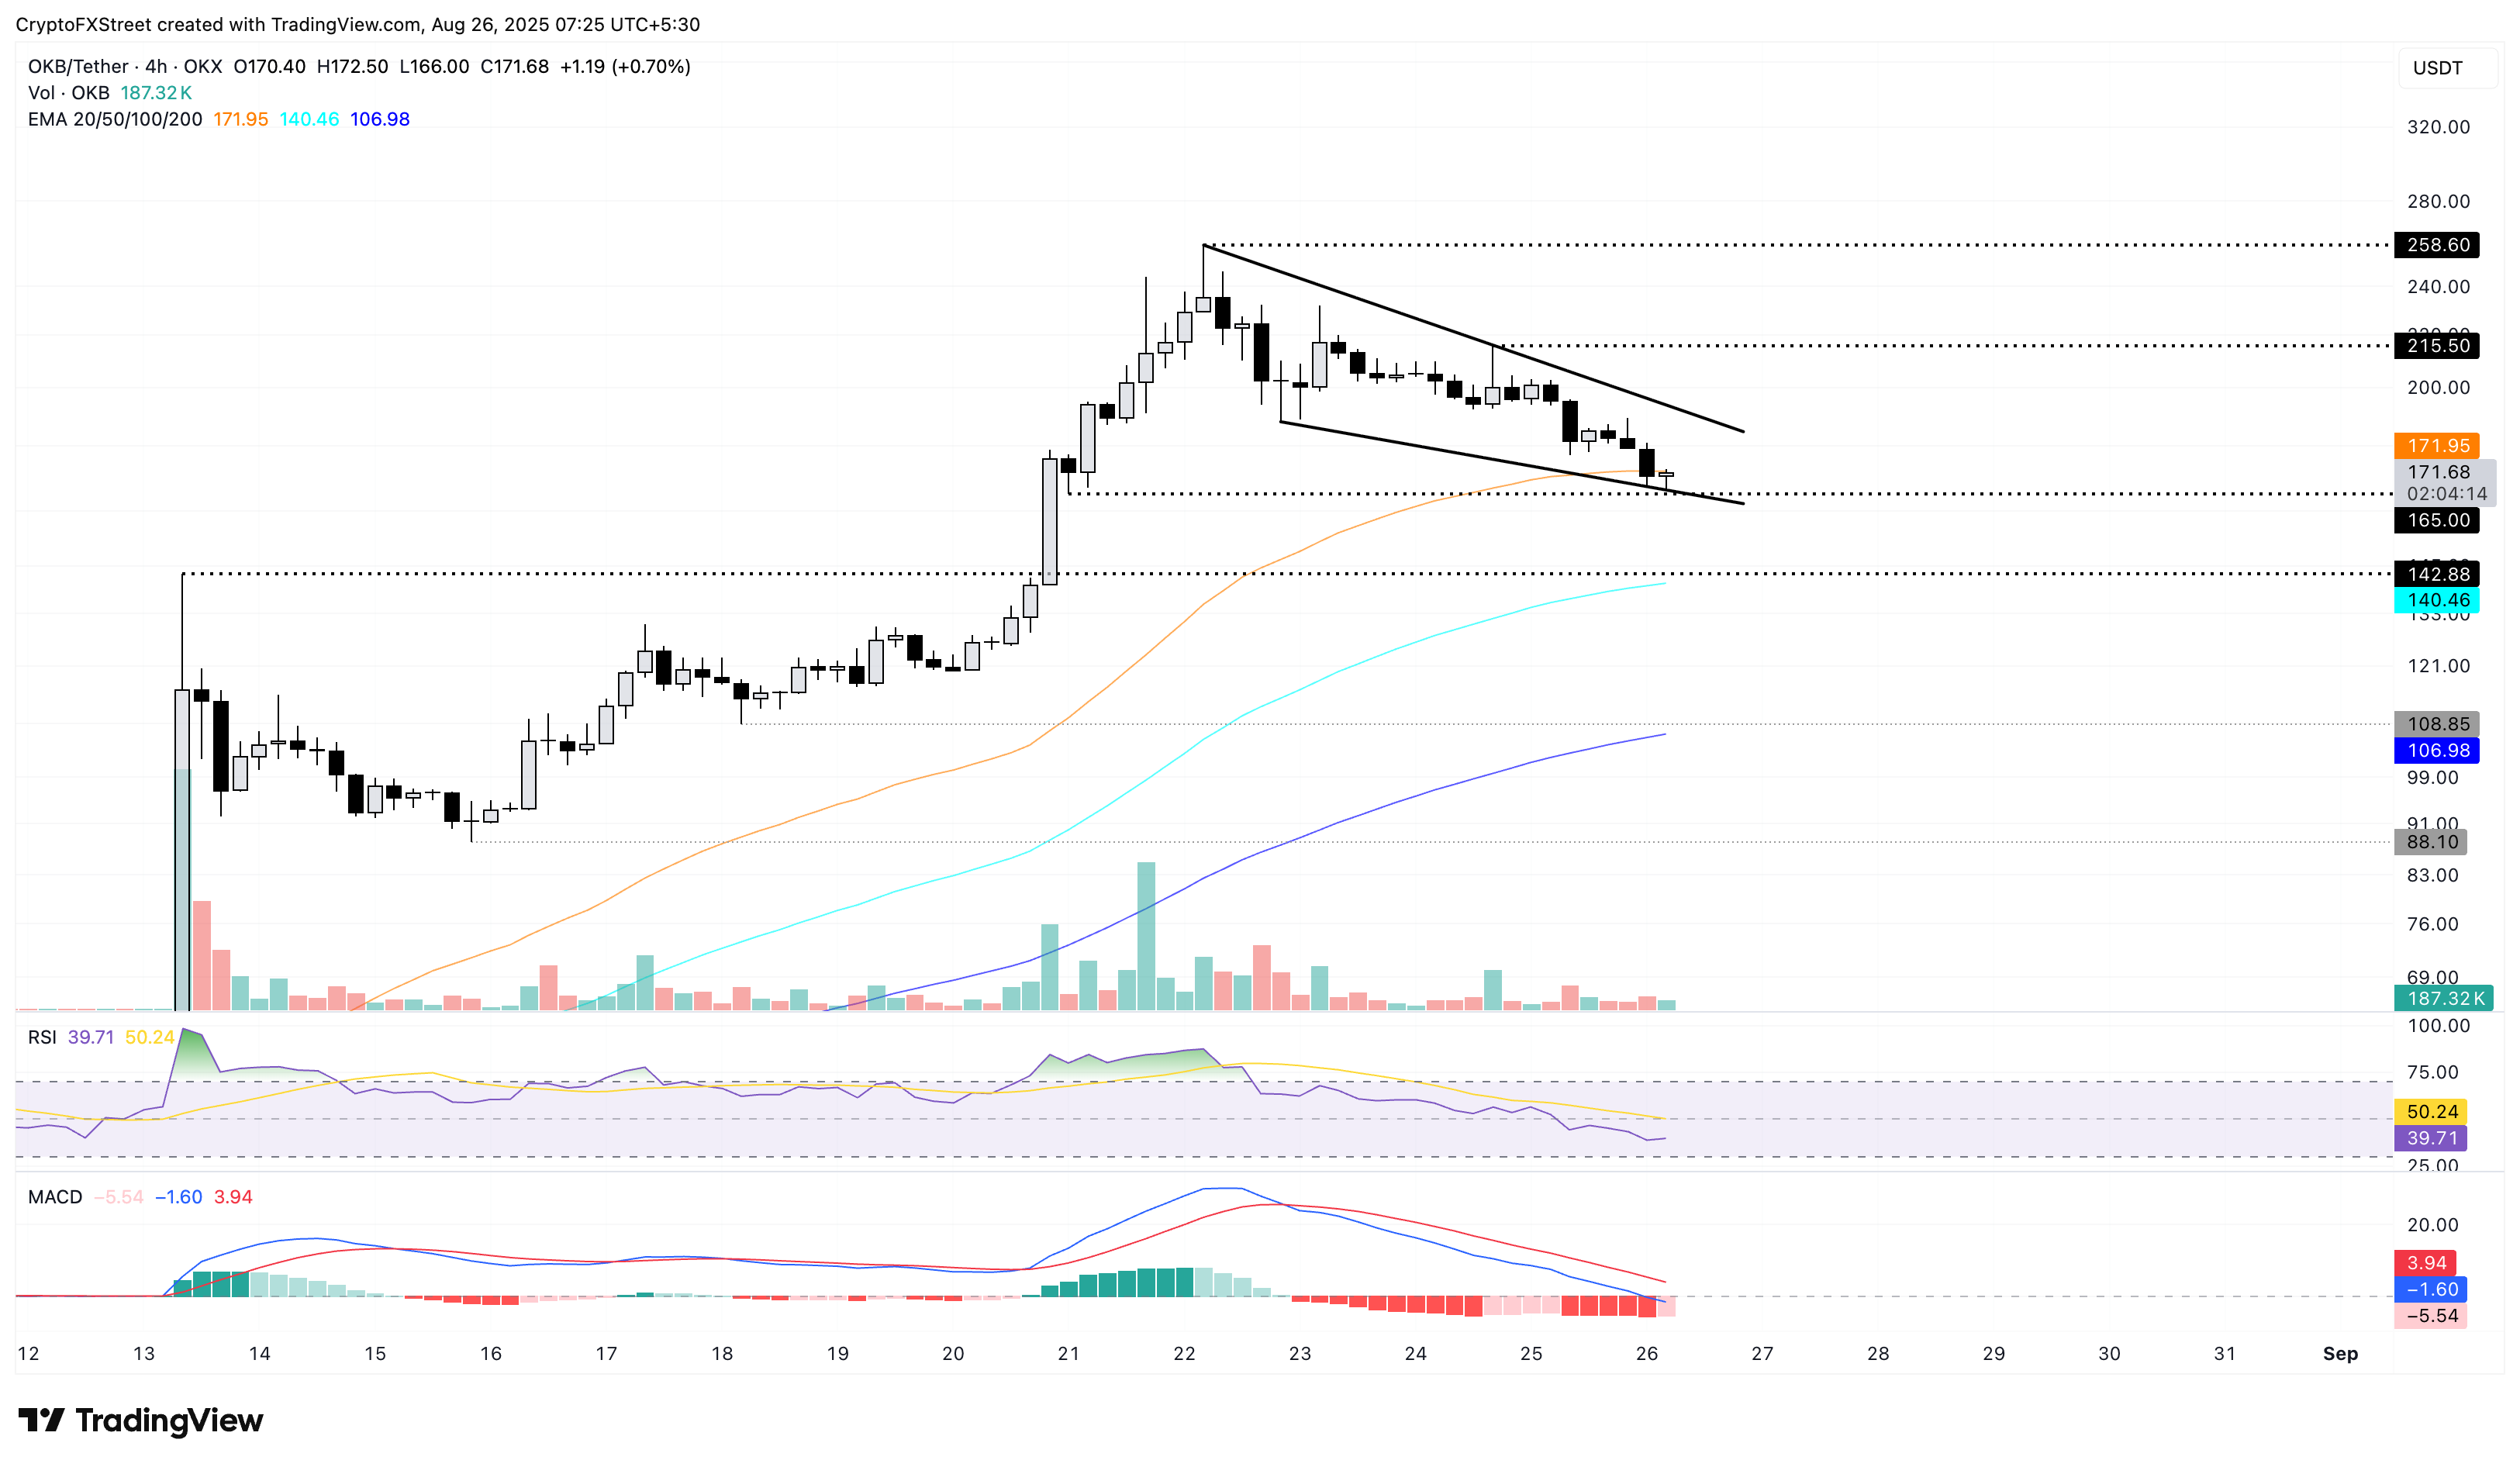
OKB/USDT daily price chart.
Looking up, if OKB bounces off the dynamic support of the 50-period EMA, it could test the upper ceiling at $195.
Curve DAO risks a falling channel pattern breakdown
Similar to OKB, CRV tests the lower boundary of a falling channel pattern formed on the daily chart (shared below). CRV trades at $0.7833 at press time near the 100-day EMA after breaching the 61.8% Fibonacci level at $0.7986, which is retraced between $1.3368 from December 7 and $0.3470 from March 11.
If CRV marks a daily close below the support trendline at $0.7626, it could extend the fall to the 50% retracement level at $0.6811.
The momentum indicators on the daily chart suggest a bearish tilt. The MACD and its signal line cross below the zero line, indicating a rise in bearish momentum, while the RSI, at 40, drops below the halfway line, suggesting room for further correction.
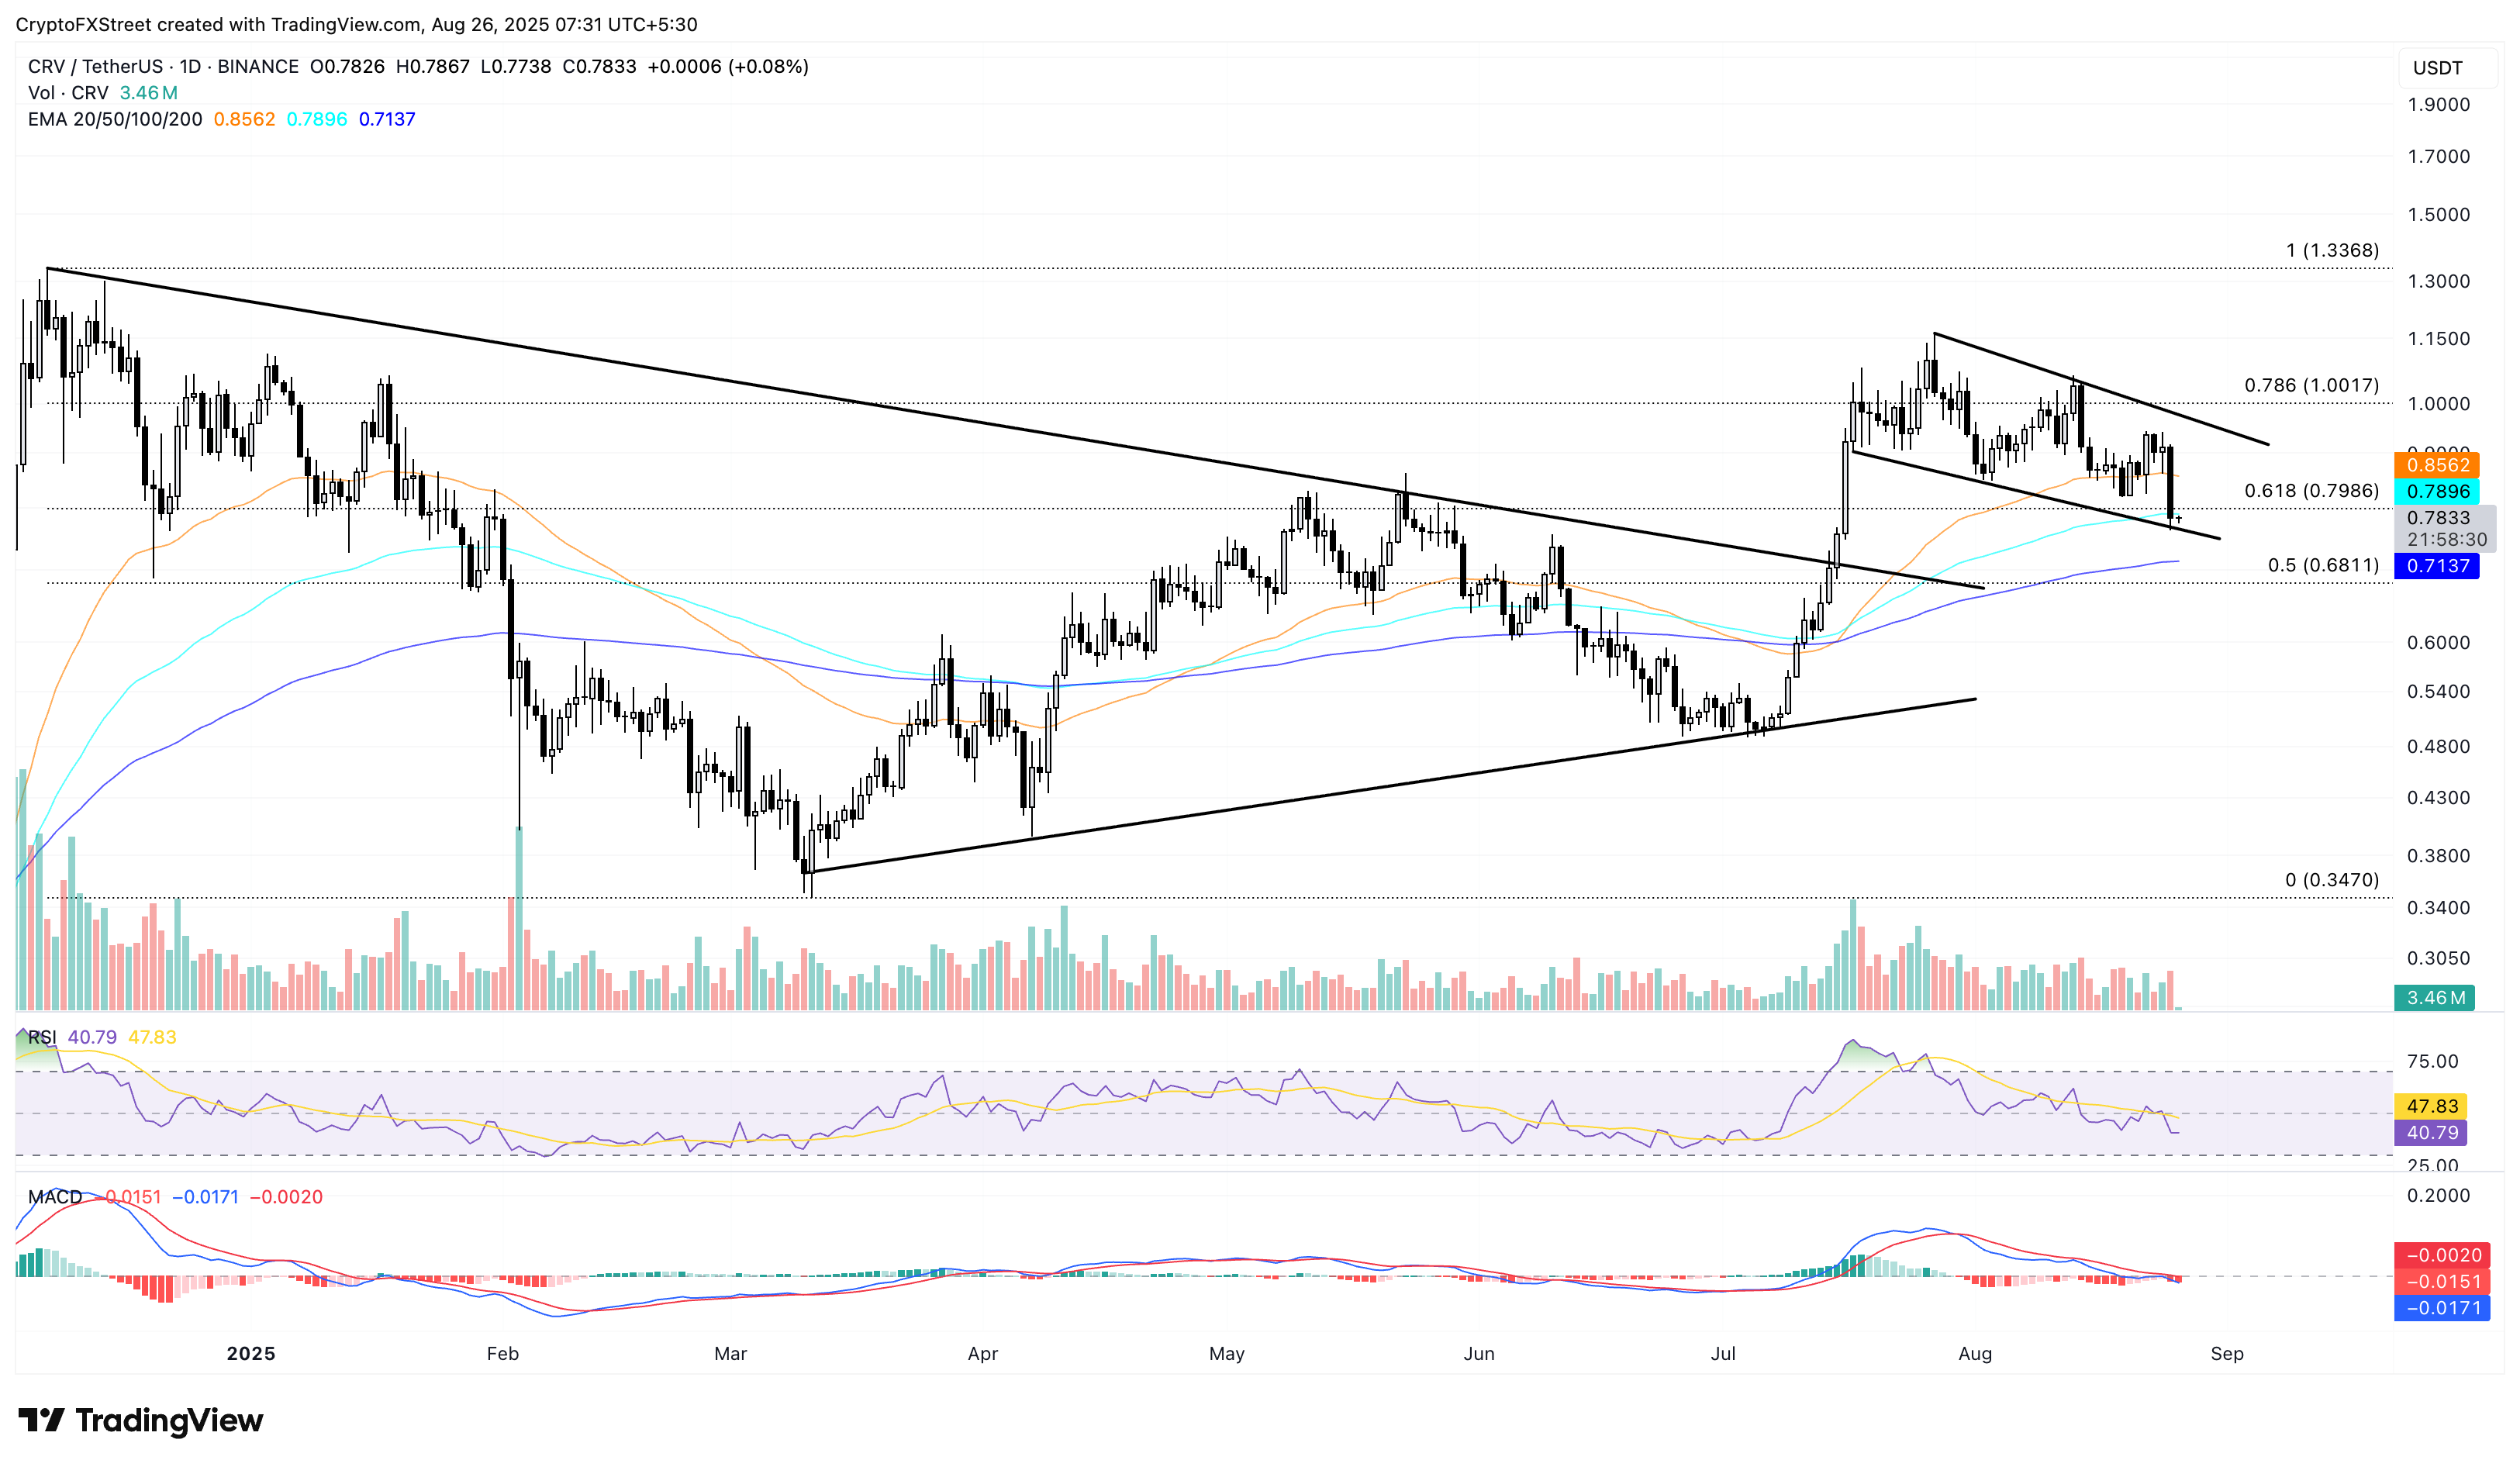
CRV/USDT daily price chart.
On the flip side, a bounce back within the falling channel pattern could test the upper trendline at $0.9650.
Recommended Articles