Toncoin Price Forecast: TON eyes breakout rally as Coinbase invests, bullish bets rise

- Toncoin consolidates below the 200-day EMA, eyeing a potential breakout.
- Coinbase Ventures invests an undisclosed amount in Toncoin.
- Bullish bets surge as traders anticipate a further recovery.
Toncoin (TON) remains muted in a consolidation, recovering just over 1% at press time on Monday, despite the announcement of Coinbase Ventures' investment. Still, bullish bets are on the rise, anticipating a bullish revival with the potential breakout of the 200-day Exponential Moving Average (EMA).
Coinbase investment boosts TON traders' confidence
The TON Foundation announced that Coinbase Ventures holds Toncoin, joining a list of investors that includes Sequoia Capital, Benchmark, and Ribbit Capital. The foundation did not reveal the actual volume of TON tokens bought by the investment branch of the Coinbase exchange.

Still, the capital inflow from another venture capital firm fuels confidence among investors. CoinGlass data shows the long positions over the last 24 hours, based on Taker buy-to-sell volume, have increased to 50.43%, up from 48.71% on Monday. This over two percentage points jump reflects increased confidence among traders.
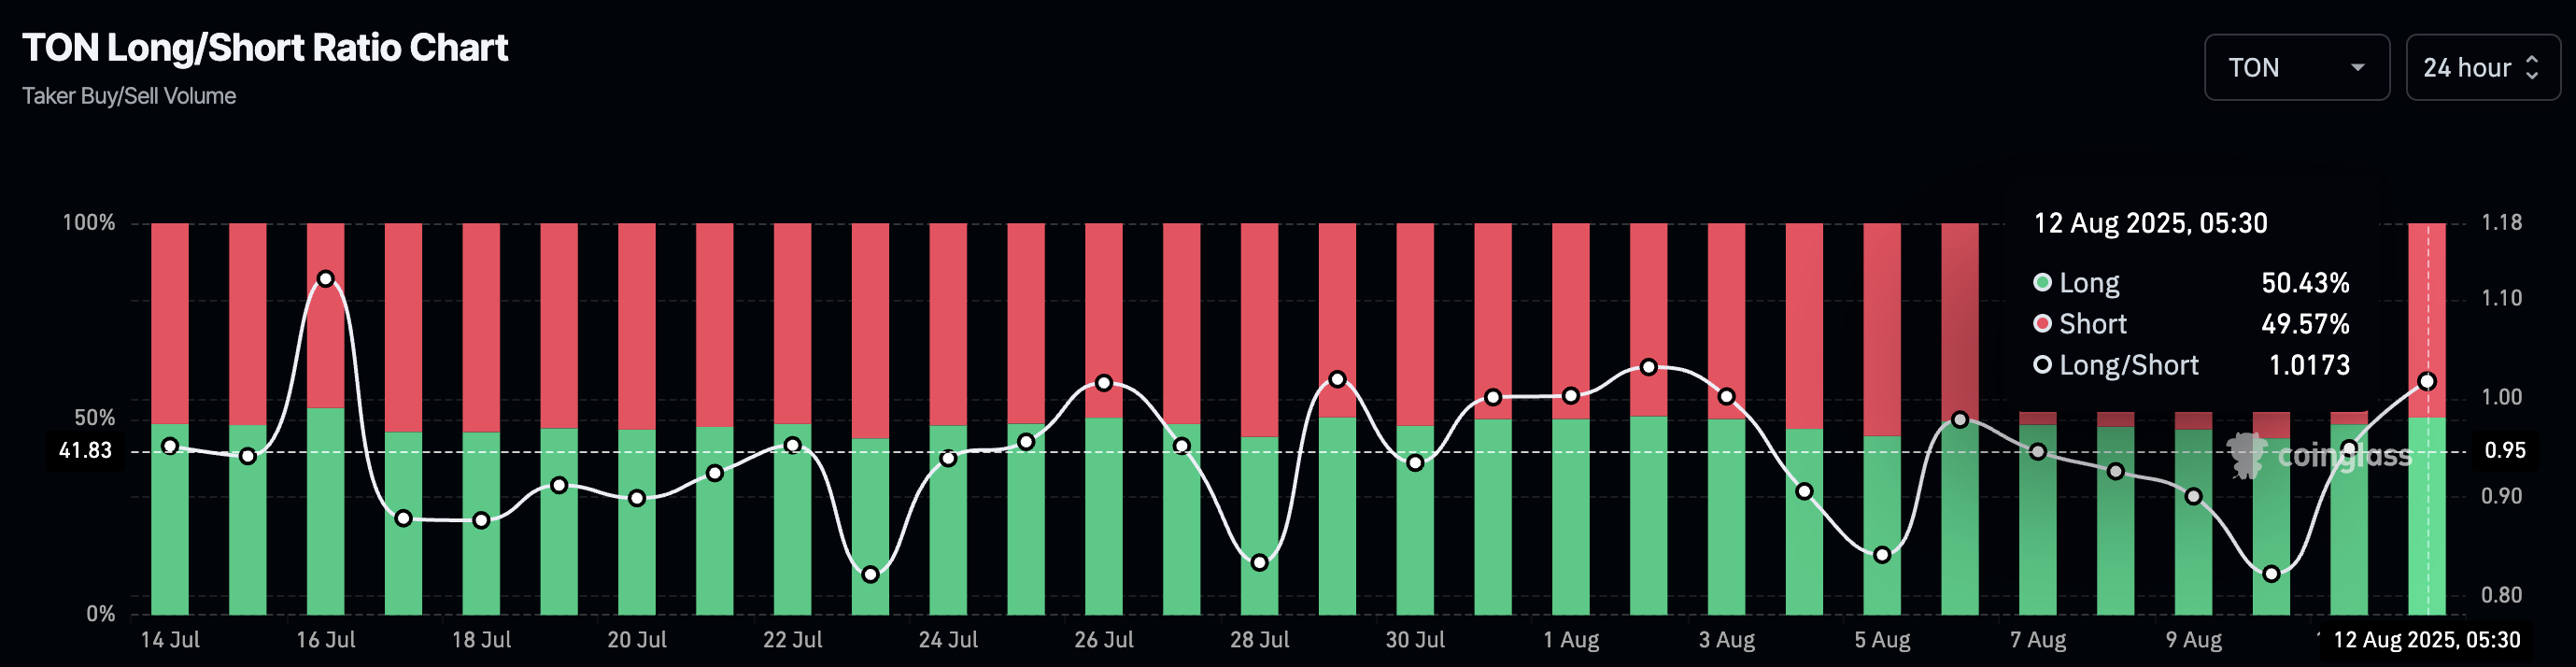
Toncoin long/short ratio. Source: Coinglass
Toncoin’s double-edged consolidation range
Toncoin moves flat for the fifth consecutive day, between the squeezing 100- and 200-day EMAs, following the 3.50% jump last Wednesday. To reinforce a bullish trend, Toncoin should achieve a decisive close above the $3.588 resistance level, last tested on August 4. The breakout rally could result in a 20% jump to $4.211 level, marked by the April 1 high.
The technical indicators remain mixed, as the Relative Strength Index (RSI) reads 56 on the daily chart, bouncing off the midpoint line and indicating increased buying pressure.
Furthermore, the 50- and 100-day EMAs are on the verge of a Golden Cross, which would mark a buy signal as short-term recovery gains traction.
Still, the Moving Average Convergence Divergence (MACD) line inches closer to its signal line, maintaining a negative alignment. This suggests a weakening bearish trend in motion.
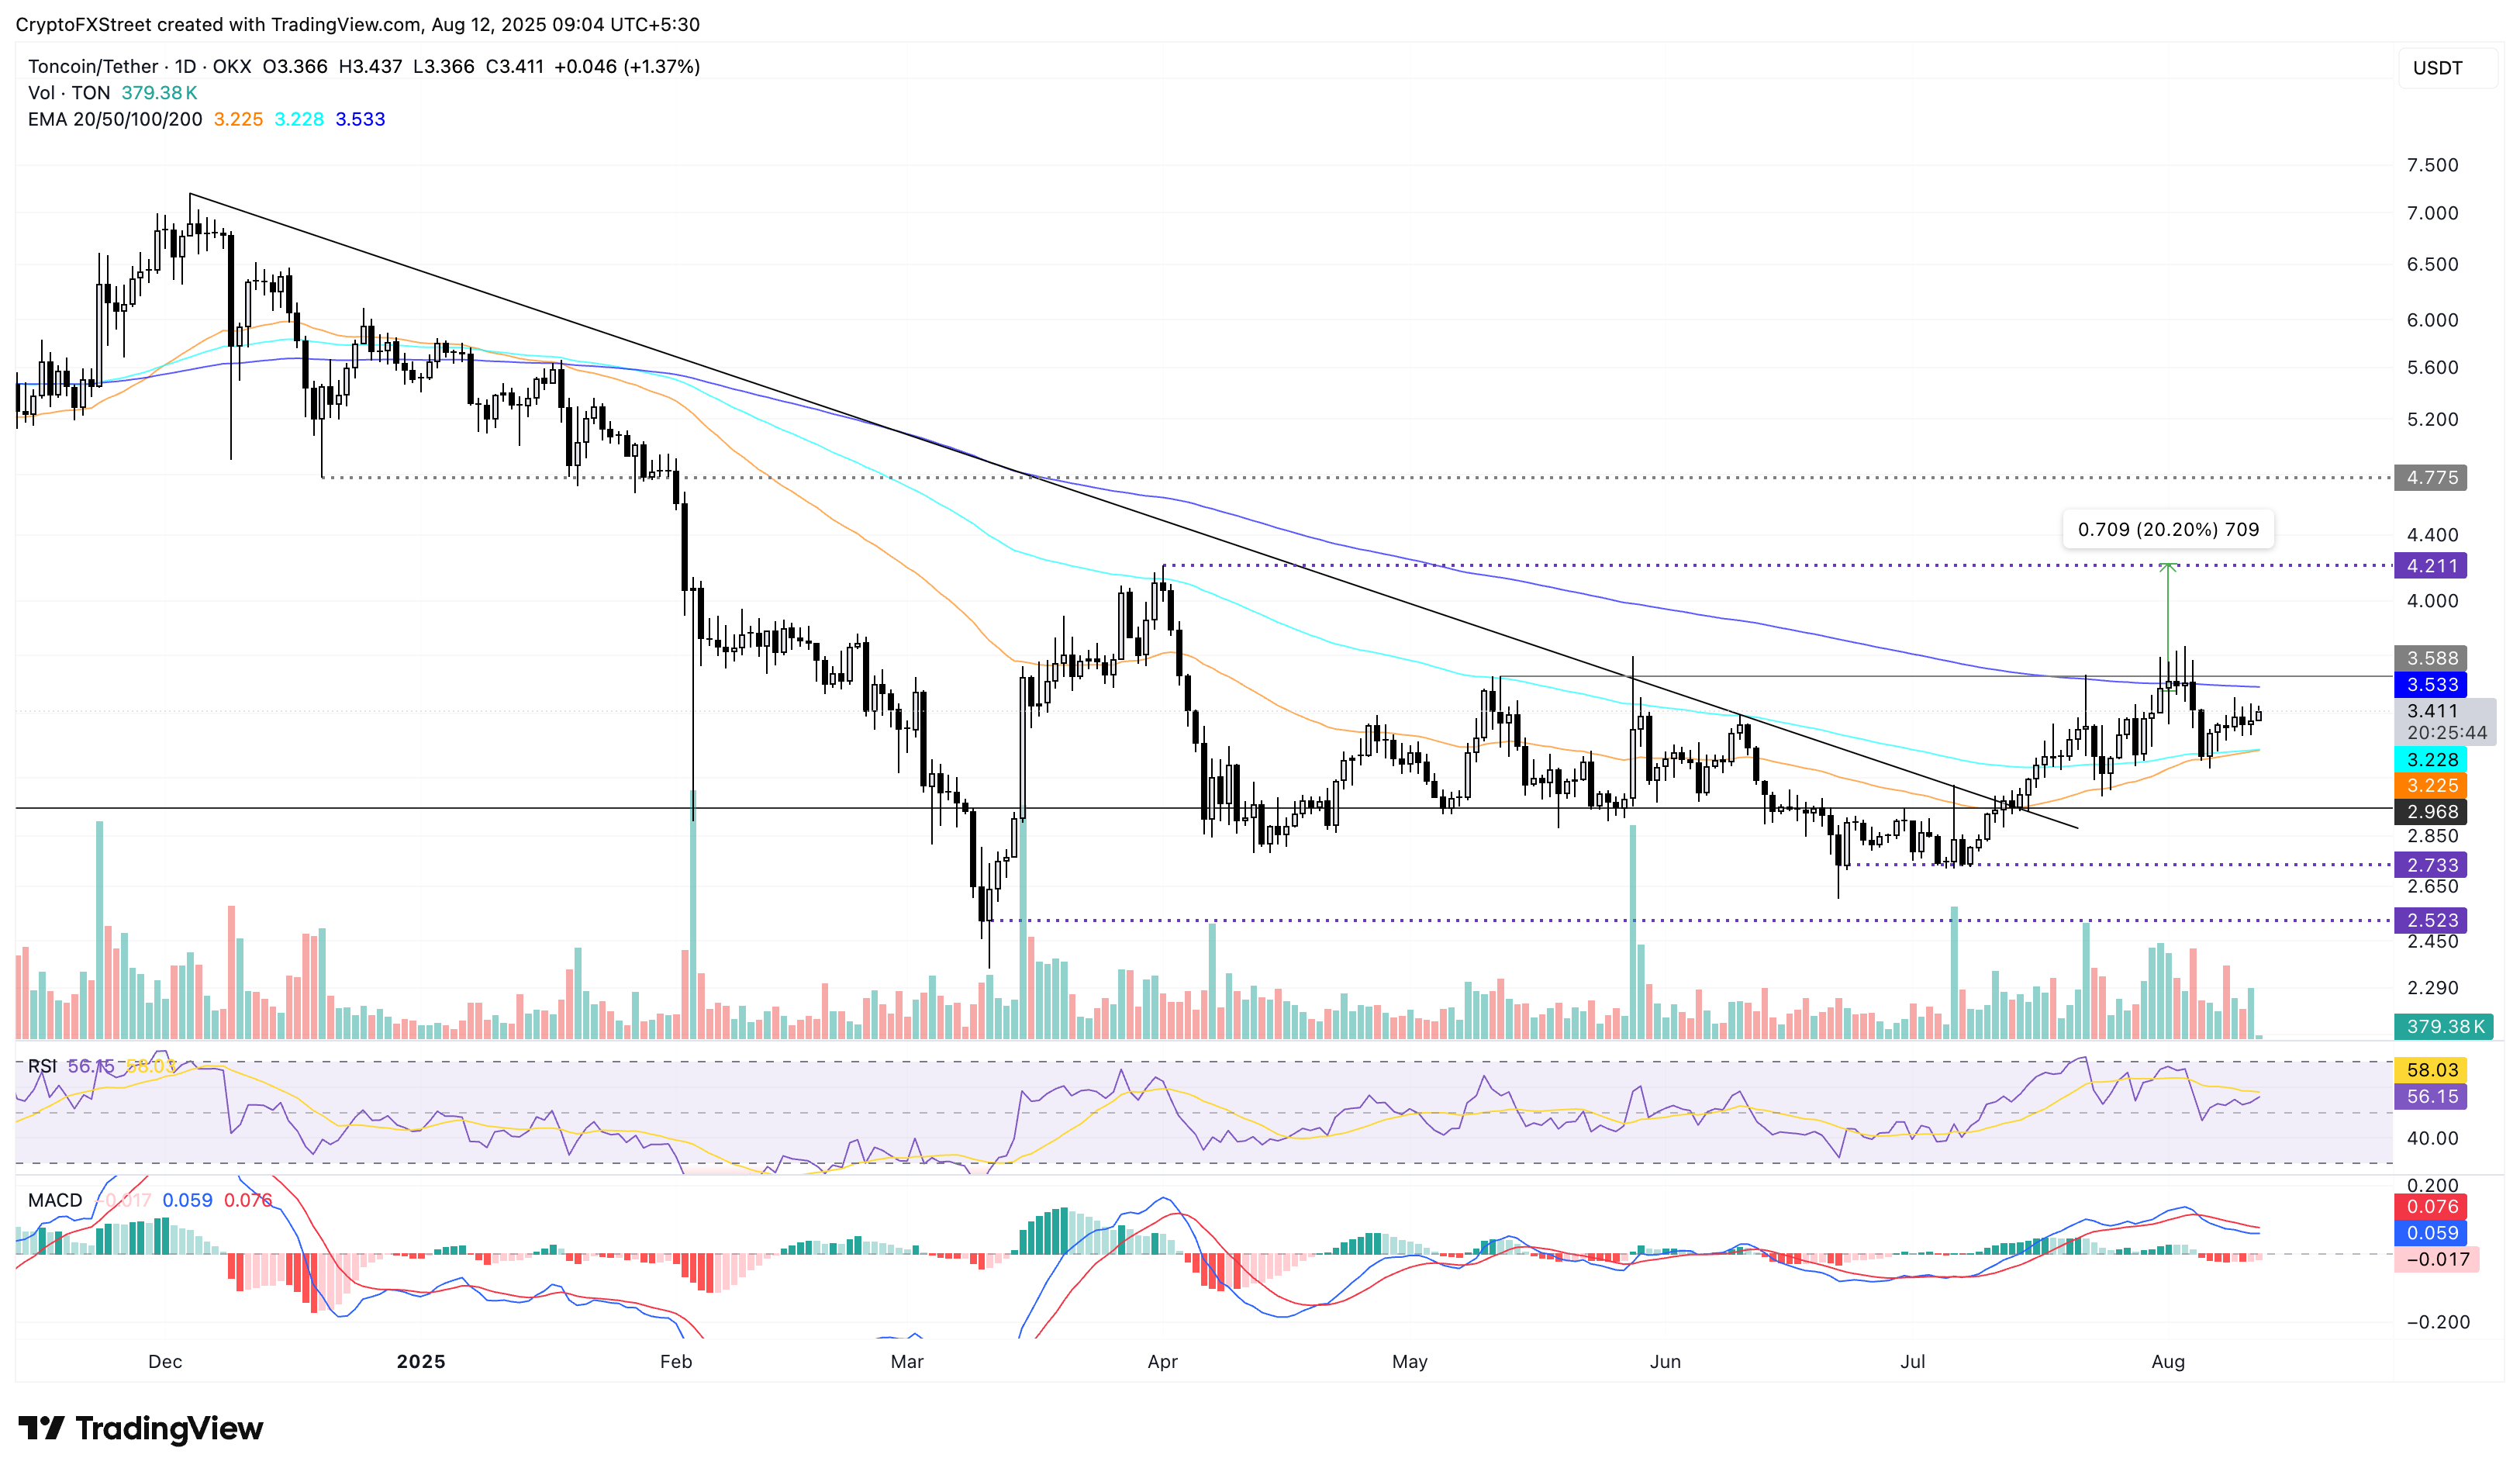
TON/USDT daily price chart.
Looking down, a decisive close below the 50-day EMA at $3.225 would invalidate the consolidation range. In such a case, TON prices could decline to the $3.000 round figure.
Related Articles
Why Sanae Takaichi Winning Japan’s Diet Election Led to a Surge in Japanese Stock Indices?
TradingKey - Reports indicate that the ruling coalition led by Japanese Prime Minister Sanae Takaichi has secured a single-party majority in the parliamentary elections held on Sunday (February 8). Following the news, the yen weakened slightly, while the Nikkei Index surpassed 57,000 for the first t
A Crash After a Surge: Why Silver Lost 40% in a Week?
TradingKey - Spot silver (XAGUSD) prices continue to decline. Silver plunged 20% on Thursday, breaking below $71 per ounce, with the sell-off intensifying on Friday as prices fell further below $64. Compared to the all-time high set on January 29, silver prices have retraced more than 40%, wiping out nearly all gains accumulated over the previous month.
Is Bitcoin’s Four-Year Cycle Dead in 2026?
Is the Bitcoin 4-year cycle dead? After 2025 broke historical records with a red post-halving year, institutional analysts explore if the Bitcoin price has decoupled from the halving countdown. Analyze the impact of spot ETFs, global liquidity, and the roadmap to the 2028 halving in this 2026 market
Why Ripple ETFs are Winning the Capital War Against Bitcoin
While Bitcoin and Ethereum ETFs face massive outflows, XRP ETFs have defied market trends with a historic 30-day inflow streak reaching $1.37 billion. Explore why institutional "smart money" is rotating into Ripple, the structural impact of the "Liquidity Lock," and why analysts set a 2026 price tar