

Top 3 Price Prediction: Bitcoin, Ethereum, Ripple – BTC nears record highs, ETH and XRP follow suit

- Bitcoin nears its all-time high of $123,218 after rallying over 4% the previous week.
- Ethereum trades in the green on Monday, approaching its key level at $4,488.
- Ripple’s XRP approaches daily resistance at $3.40, with a close above potentially fueling a rally toward record highs.
Bitcoin (BTC), Ethereum (ETH), and Ripple (XRP) kicked off the week on a bullish note, with BTC inching closer to its record high of $123,218. Meanwhile, ETH is testing a critical resistance level, and XRP is on the verge of a potential breakout.
Bitcoin nears its record highs
Bitcoin price found support around its previous all-time high of $111,980 on August 3 and rallied 6% until Sunday. At the time of writing on Monday, it trades above its psychological level at $120,000.
If BTC continues its upward trend, it could extend the rally toward its record high of $123,218 on July 14.
The Relative Strength Index (RSI) on the daily chart reads 65, above its neutral level of 50, indicating strong bullish momentum. The Moving Average Convergence Divergence (MACD) is showing a bullish crossover on Monday, giving buy signals and indicating the start of an upward trend.
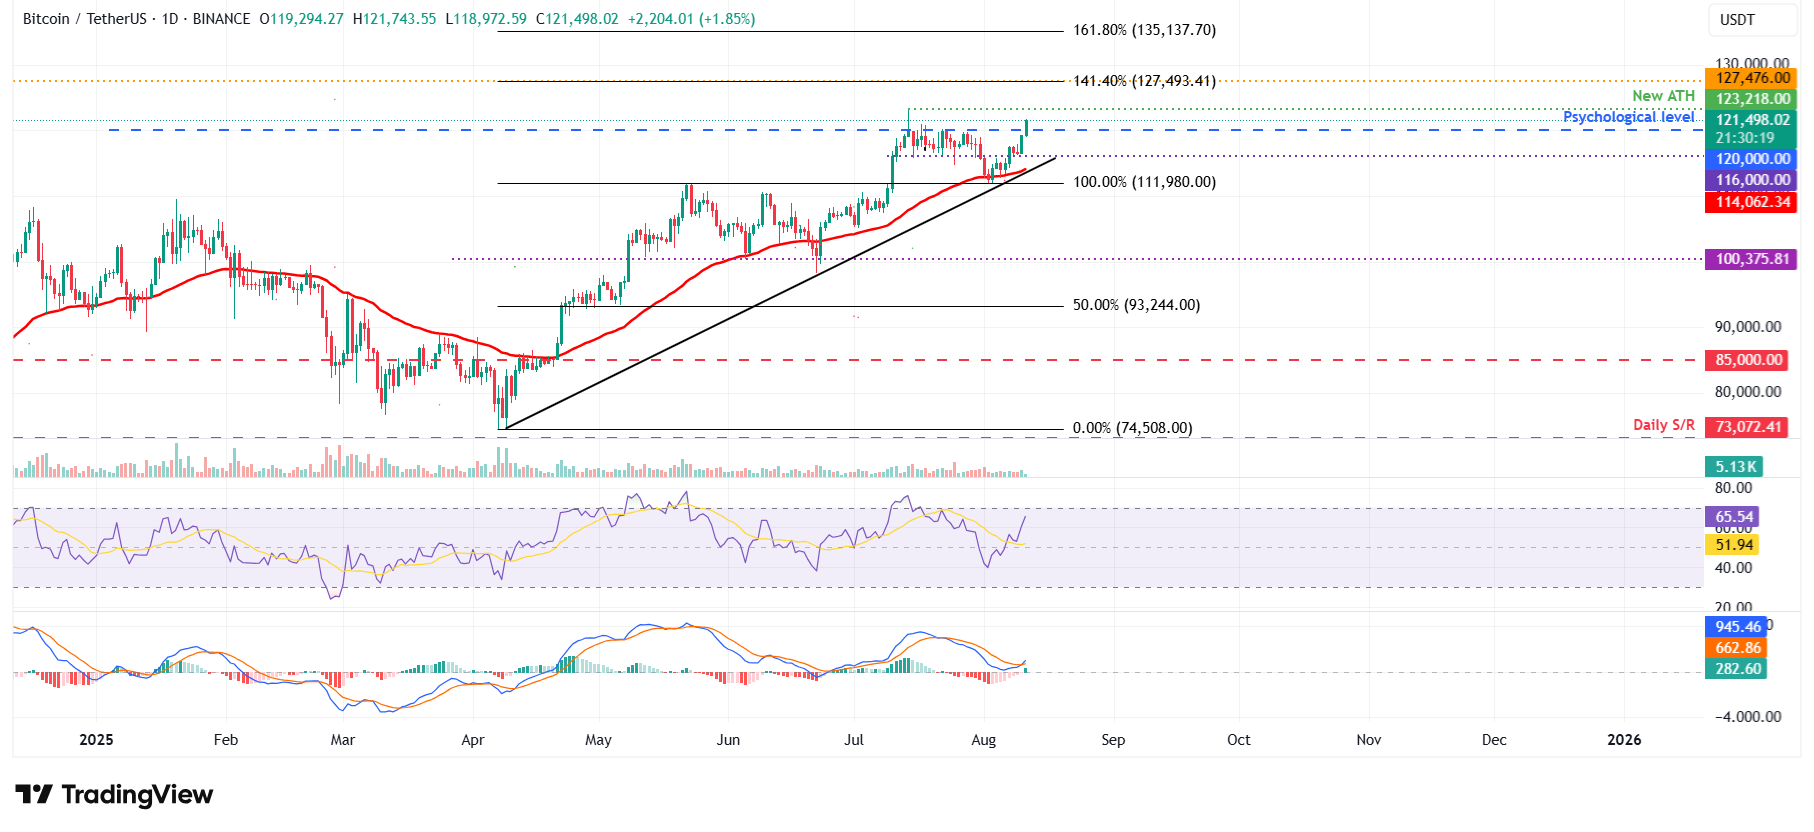
BTC/USDT daily chart
However, if BTC faces a correction, it could extend the decline to find support around the daily level at $116,000.
Ethereum bulls aiming for $4,488 mark
Ethereum price closed above its psychological level of $4,000 on Saturday, gaining nearly 22% in the previous week. At the time of writing on Monday, it continues to trade higher above $4,300.
If Ethereum continues its upward trend, it could extend the rally toward the December 9, 2021, high of $4,488.
The RSI on the daily chart reads 73, above its overbought levels of 70 and points upward, indicating strong bullish momentum. The MACD showed a bullish crossover on Saturday and further supports the bullish thesis.
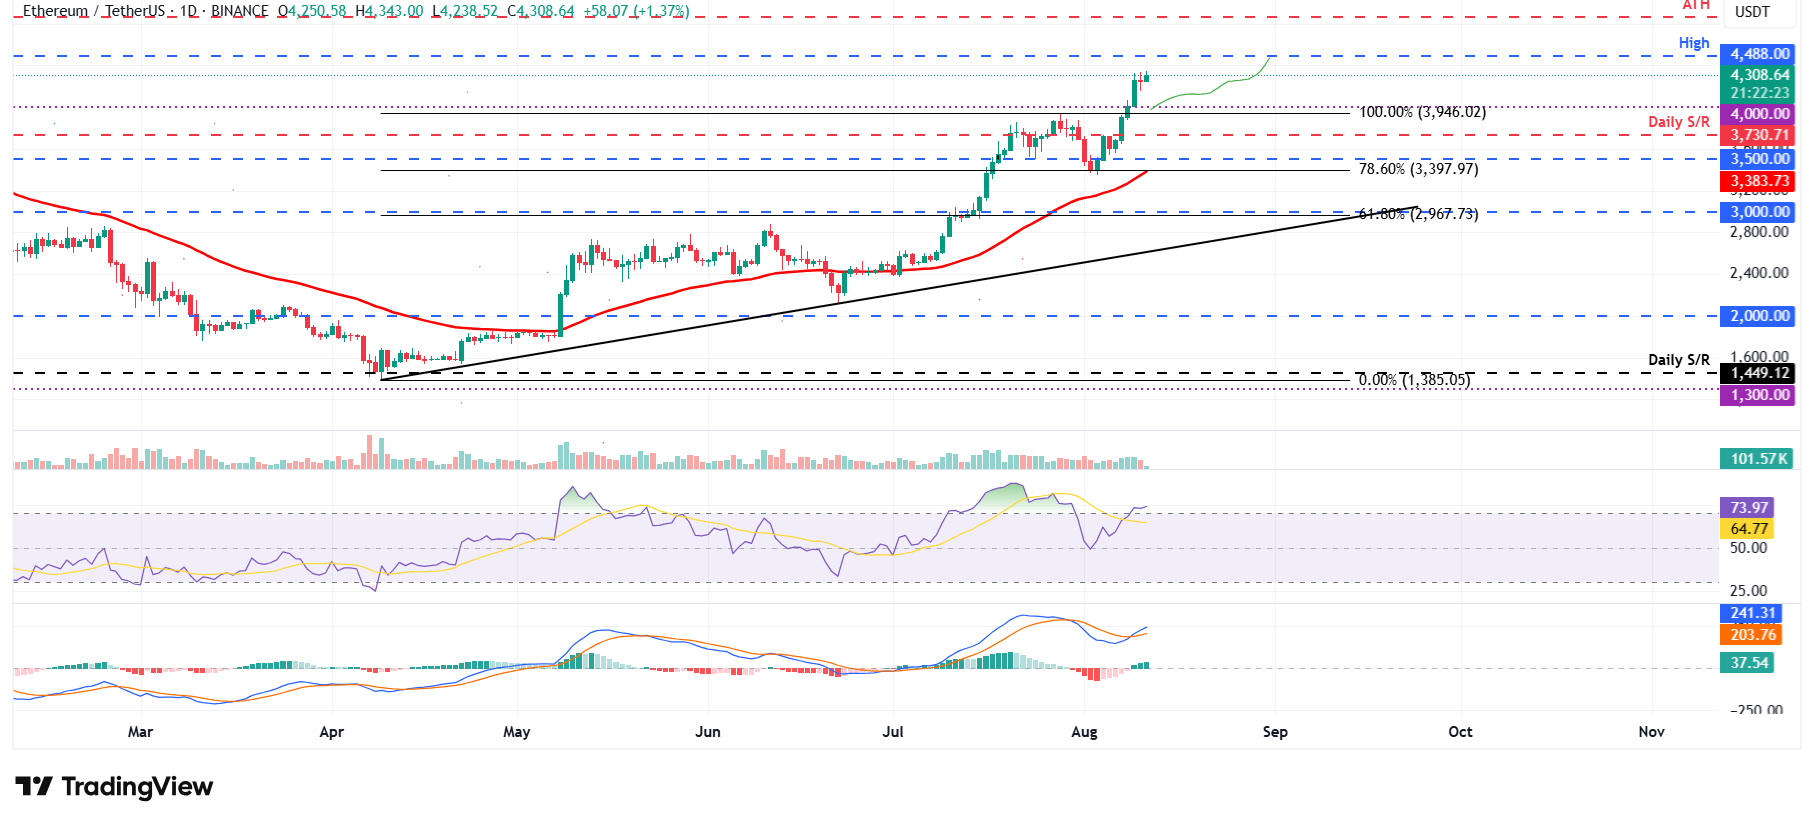
ETH/USDT daily chart
On the other hand, if ETH faces a correction, it could extend the decline to find support around $4,000.
XRP could rally toward its record high if it closes above $3.40
XRP price found support around the 50% retracement level $2.78 on August 3 and rallied 8% in the previous week. At the time of writing on Friday, it continues its rally, trading above $3.26.
If XRP closes above the $3.40 daily resistance, it could fuel the rally toward record highs at $3.66.
The RSI on the daily chart reads 58, above its neutral level of 50, indicating bullish momentum is gaining traction.
On the daily chart, the MACD indicator lines converge, suggesting indecisiveness among traders. For the bullish momentum to be sustained, the MACD lines must flip to a bullish crossover, like ETH and BTC.
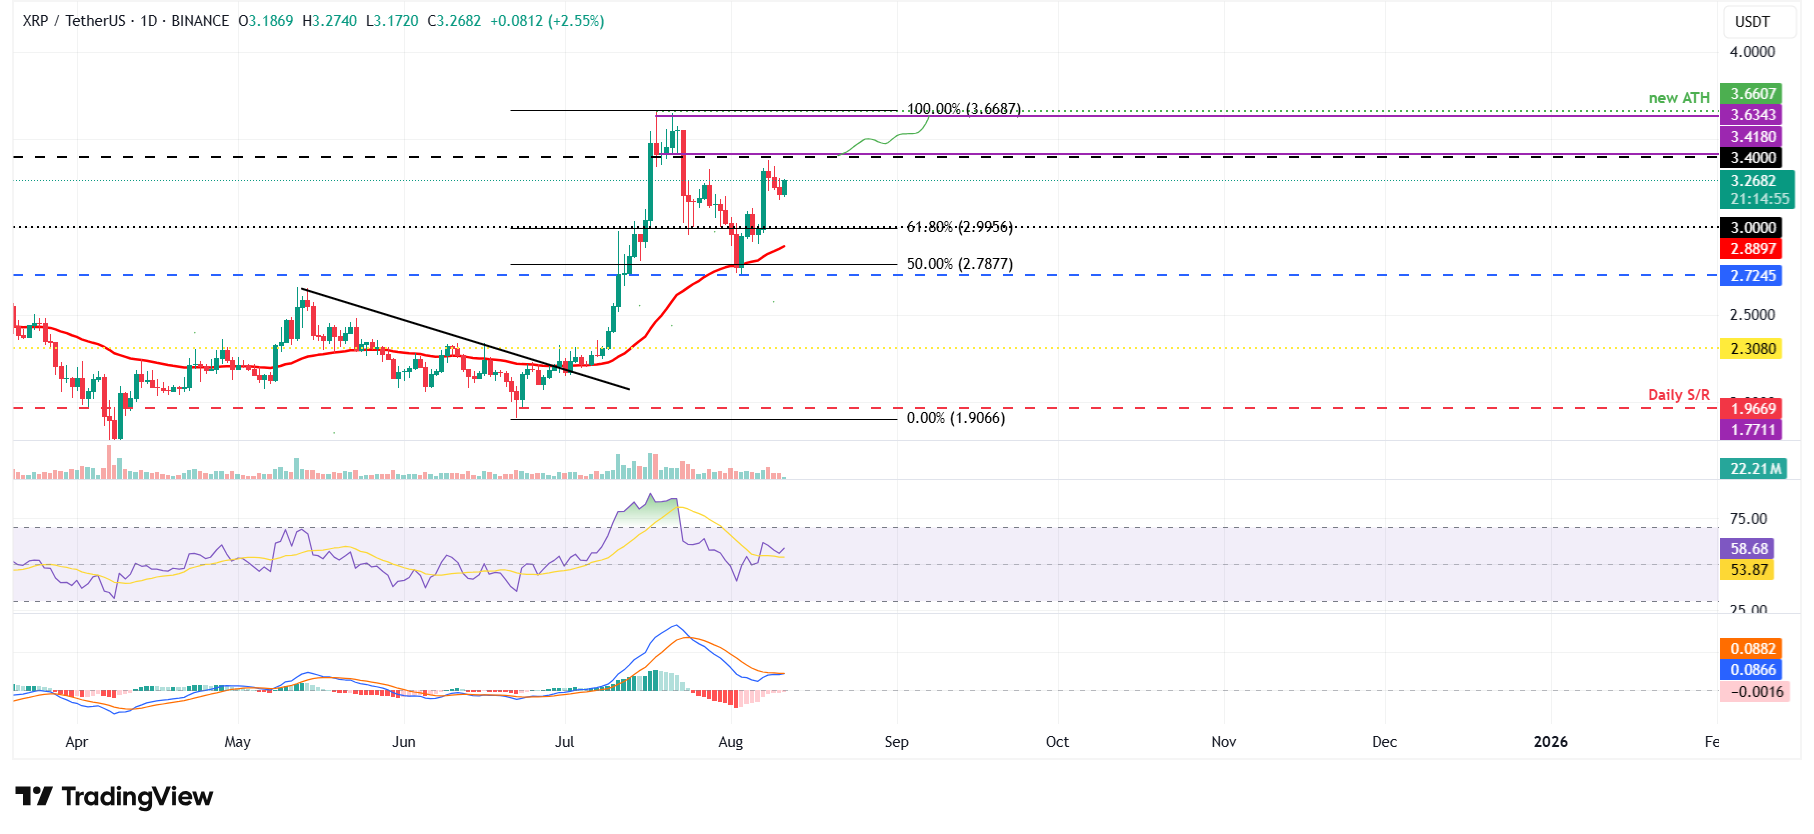
XRP/USDT daily chart
Conversely, if XRP fails to close above the $3.40 resistance and faces a correction, it could extend the pullback toward its 50-day EMA at $2.88.
Cryptocurrency metrics FAQs
The developer or creator of each cryptocurrency decides on the total number of tokens that can be minted or issued. Only a certain number of these assets can be minted by mining, staking or other mechanisms. This is defined by the algorithm of the underlying blockchain technology. On the other hand, circulating supply can also be decreased via actions such as burning tokens, or mistakenly sending assets to addresses of other incompatible blockchains.
Market capitalization is the result of multiplying the circulating supply of a certain asset by the asset’s current market value.
Trading volume refers to the total number of tokens for a specific asset that has been transacted or exchanged between buyers and sellers within set trading hours, for example, 24 hours. It is used to gauge market sentiment, this metric combines all volumes on centralized exchanges and decentralized exchanges. Increasing trading volume often denotes the demand for a certain asset as more people are buying and selling the cryptocurrency.
Funding rates are a concept designed to encourage traders to take positions and ensure perpetual contract prices match spot markets. It defines a mechanism by exchanges to ensure that future prices and index prices periodic payments regularly converge. When the funding rate is positive, the price of the perpetual contract is higher than the mark price. This means traders who are bullish and have opened long positions pay traders who are in short positions. On the other hand, a negative funding rate means perpetual prices are below the mark price, and hence traders with short positions pay traders who have opened long positions.
Related Articles
Amazon Stock Predictions for 2026 to 2030: Will They Exceed Expectations and Achieve Major Long-Term Goals?
TradingKey - As we head into 2026, many investors are questioning where Amazon (AMZN) fits into the technology world.
A Crash After a Surge: Why Silver Lost 40% in a Week?
TradingKey - Spot silver (XAGUSD) prices continue to decline. Silver plunged 20% on Thursday, breaking below $71 per ounce, with the sell-off intensifying on Friday as prices fell further below $64. Compared to the all-time high set on January 29, silver prices have retraced more than 40%, wiping out nearly all gains accumulated over the previous month.
Is Bitcoin’s Four-Year Cycle Dead in 2026?
Is the Bitcoin 4-year cycle dead? After 2025 broke historical records with a red post-halving year, institutional analysts explore if the Bitcoin price has decoupled from the halving countdown. Analyze the impact of spot ETFs, global liquidity, and the roadmap to the 2028 halving in this 2026 market
USD Dollar Trend Forecast: Dollar Index Falls Below 97.0 to 4-Year Low, Will the Dollar Continue To Fall or Bottom Out in 2026?
TradingKey - In January 2026, the US Dollar Index continued its downward trend from 2025, officially breaking below the key 97.0 level and reaching a low of 95.5, marking a nearly four-year low since February 2022.

