

Hyperliquid Price Forecast: Bears aim for levels below $30 as short bets rise

- Hyperliquid extends losses after falling to close above a key resistance level earlier this week.
- On-chain and derivatives data support the bearish outlook as Spot Taker CVD is in negative territory and short positions hit a one-month high.
- The technical outlook suggests a correction, with bears targeting levels below $30.
Hyperliquid (HYPE) is trading in red at around $37.50 on Wednesday after failing to close above a key resistance earlier this week. This downturn is further supported by on-chain and derivatives metrics, which show HYPE’s rising sell dominant phase and short positions hitting a one-month high. The technical analysis suggests a potential downward trend continuation, targeting levels below $30.
Hyperliquid on-chain, derivatives metrics turn bearish
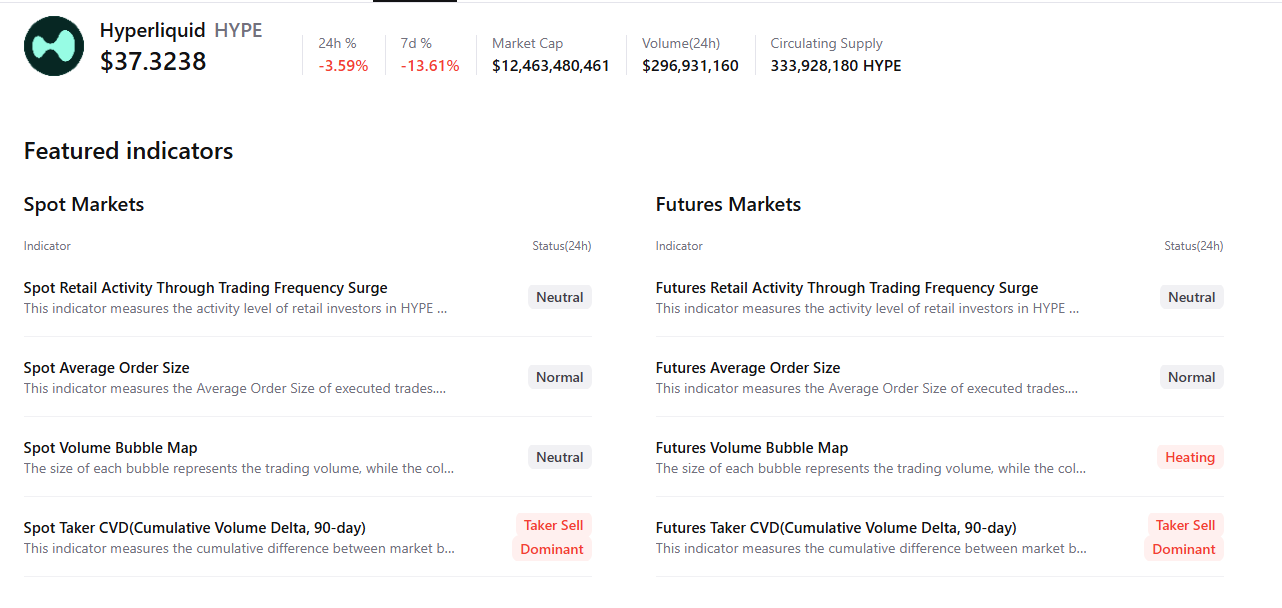
CryptoQuant data highlights the rising selling pressure on Hyperliquid. The Taker CVD (Cumulative Volume Delta) for HYPE is negative, and its value has been steadily decreasing since mid-July. This metric measures the cumulative difference between market buy and sell volumes over three months. When the three-month CVD is positive and increasing, it suggests the Taker Buy Dominant Phase, while a negative and decreasing value, as it is currently happening, indicates the Taker Sell Dominant Phase.
-1754467775031-1754467775043.png)
Hyperliquid Spot Taker CVD chart. Source: CryptoQuant
CryptoQuant’s summary data also indicates that Hyperliquid’s futures market activity is heating up as more traders are opening leveraged positions alongside negative Spot Taker CVD, signaling a potential correction ahead.
The bearish outlook is further supported by Coinglass' long-to-short ratio, which stands at 0.77 on Wednesday, marking the lowest level in over a month. A ratio below one suggests bearish sentiment in the market as traders are betting that the asset price will fall.
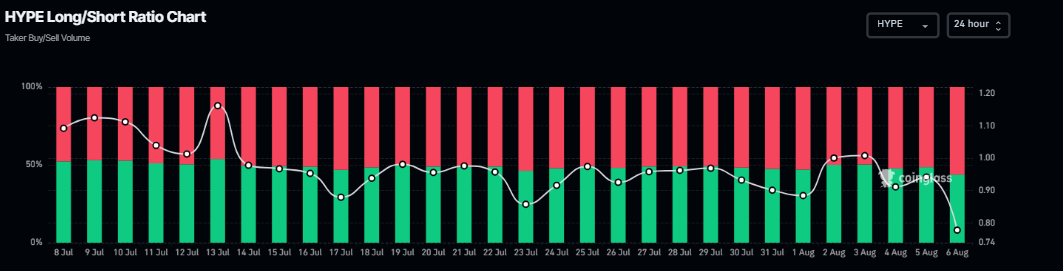
HYPE long-to-short ratio chart. Source: CoinGlass
Hyperliquid Price Forecast: Bears targeting levels below $30
Hyperliquid price broke below the ascending trendline (drawn by connecting multiple lows since early April) on Thursday and declined 10.34%, closing below the daily support at $38.87 in the next two days.
However, HYPE recovered slightly from Sunday to Monday but failed to close above its daily resistance at $38.87 and declined slightly the next day. At the time of writing on Wednesday, it continues to trade down around $37.64.
If HYPE continues its downward trend, it could retest its 61.80% Fibonacci retracement level at $34.40 (drawn from April's low of $9.32 to July's all-time high of $49.88). A successful close below this level could extend the loss to retest its weekly level at $27.49.
The Relative Strength Index (RSI) on the daily chart reads 39, below its neutral value of 50, indicating strong bearish momentum. The Moving Average Convergence Divergence (MACD) showed a bearish crossover on July 23 that still holds, also indicating bearish momentum.
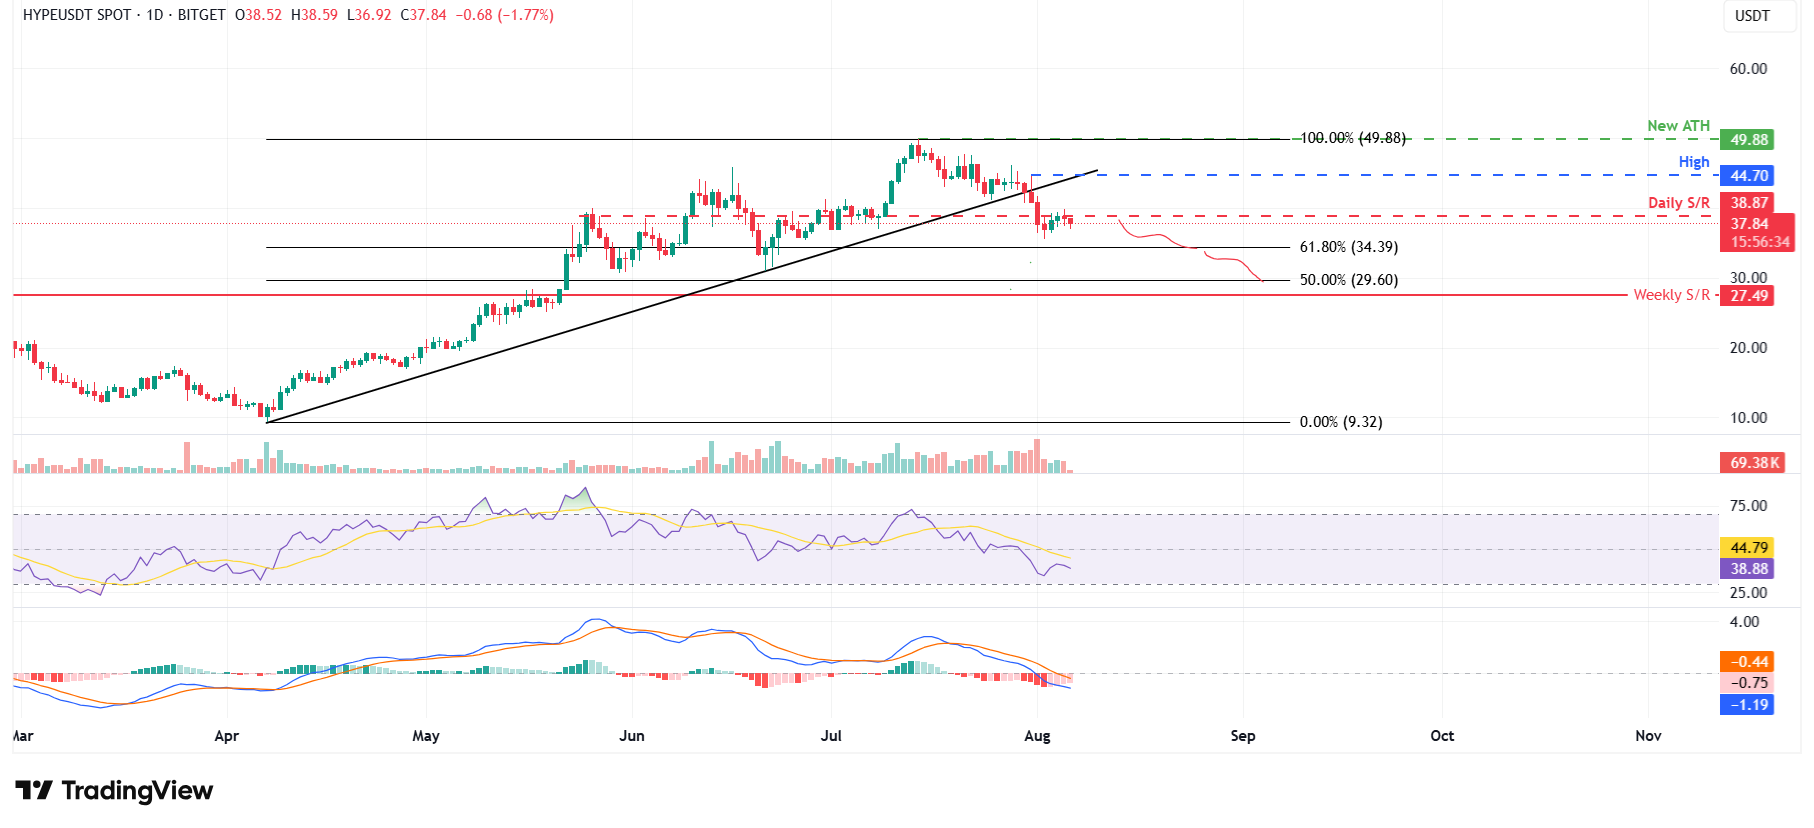
HYPE/USDT daily chart
If HYPE closes above the daily resistance at $38.87, it could extend the recovery toward the July 31 high of $44.70.
Related Articles
Amazon Stock Predictions for 2026 to 2030: Will They Exceed Expectations and Achieve Major Long-Term Goals?
TradingKey - As we head into 2026, many investors are questioning where Amazon (AMZN) fits into the technology world.
A Crash After a Surge: Why Silver Lost 40% in a Week?
TradingKey - Spot silver (XAGUSD) prices continue to decline. Silver plunged 20% on Thursday, breaking below $71 per ounce, with the sell-off intensifying on Friday as prices fell further below $64. Compared to the all-time high set on January 29, silver prices have retraced more than 40%, wiping out nearly all gains accumulated over the previous month.
Is Bitcoin’s Four-Year Cycle Dead in 2026?
Is the Bitcoin 4-year cycle dead? After 2025 broke historical records with a red post-halving year, institutional analysts explore if the Bitcoin price has decoupled from the halving countdown. Analyze the impact of spot ETFs, global liquidity, and the roadmap to the 2028 halving in this 2026 market
USD Dollar Trend Forecast: Dollar Index Falls Below 97.0 to 4-Year Low, Will the Dollar Continue To Fall or Bottom Out in 2026?
TradingKey - In January 2026, the US Dollar Index continued its downward trend from 2025, officially breaking below the key 97.0 level and reaching a low of 95.5, marking a nearly four-year low since February 2022.

