Top Crypto Gainers: MemeCore drives crypto rally, Mantle and Litecoin target higher resistance

- MemeCore recovery run surpasses key resistance, eyes further gains.
- Mantle edges lower by 2% after rebounding nearly 20% on Monday.
- Litecoin eyes further gains as a sudden rebound nears, surpassing monthly resistance.
MemeCore (M) leads the broader cryptocurrency market recovery, with a 25% surge over the last 24 hours, followed by Mantle (MNT) and Litecoin (LTC), which rebounded 16% and 10%, respectively. The technical outlook for MemeCore suggests an overbought risk, while Mantle and Litecoin are expected to surpass key resistances for further gains.
MemeCore rally risks overbought conditions
MemeCore loses steam by over 2% at press time on Tuesday following the 31% gains from the previous day. The uptrend surpassed the 23.6% trend-based Fibonacci level at $0.5430, with bulls targeting the 50% retracement level at $0.7968.
However, investors should exercise caution, as the Relative Strength Index (RSI) reads 84 on the 4-hour chart, indicating overbought conditions that may signal a sudden exhaustion in buying pressure.
The Moving Average Convergence Divergence (MACD) line maintains an uptrend with its signal line reflecting a steady growth in bullish momentum.
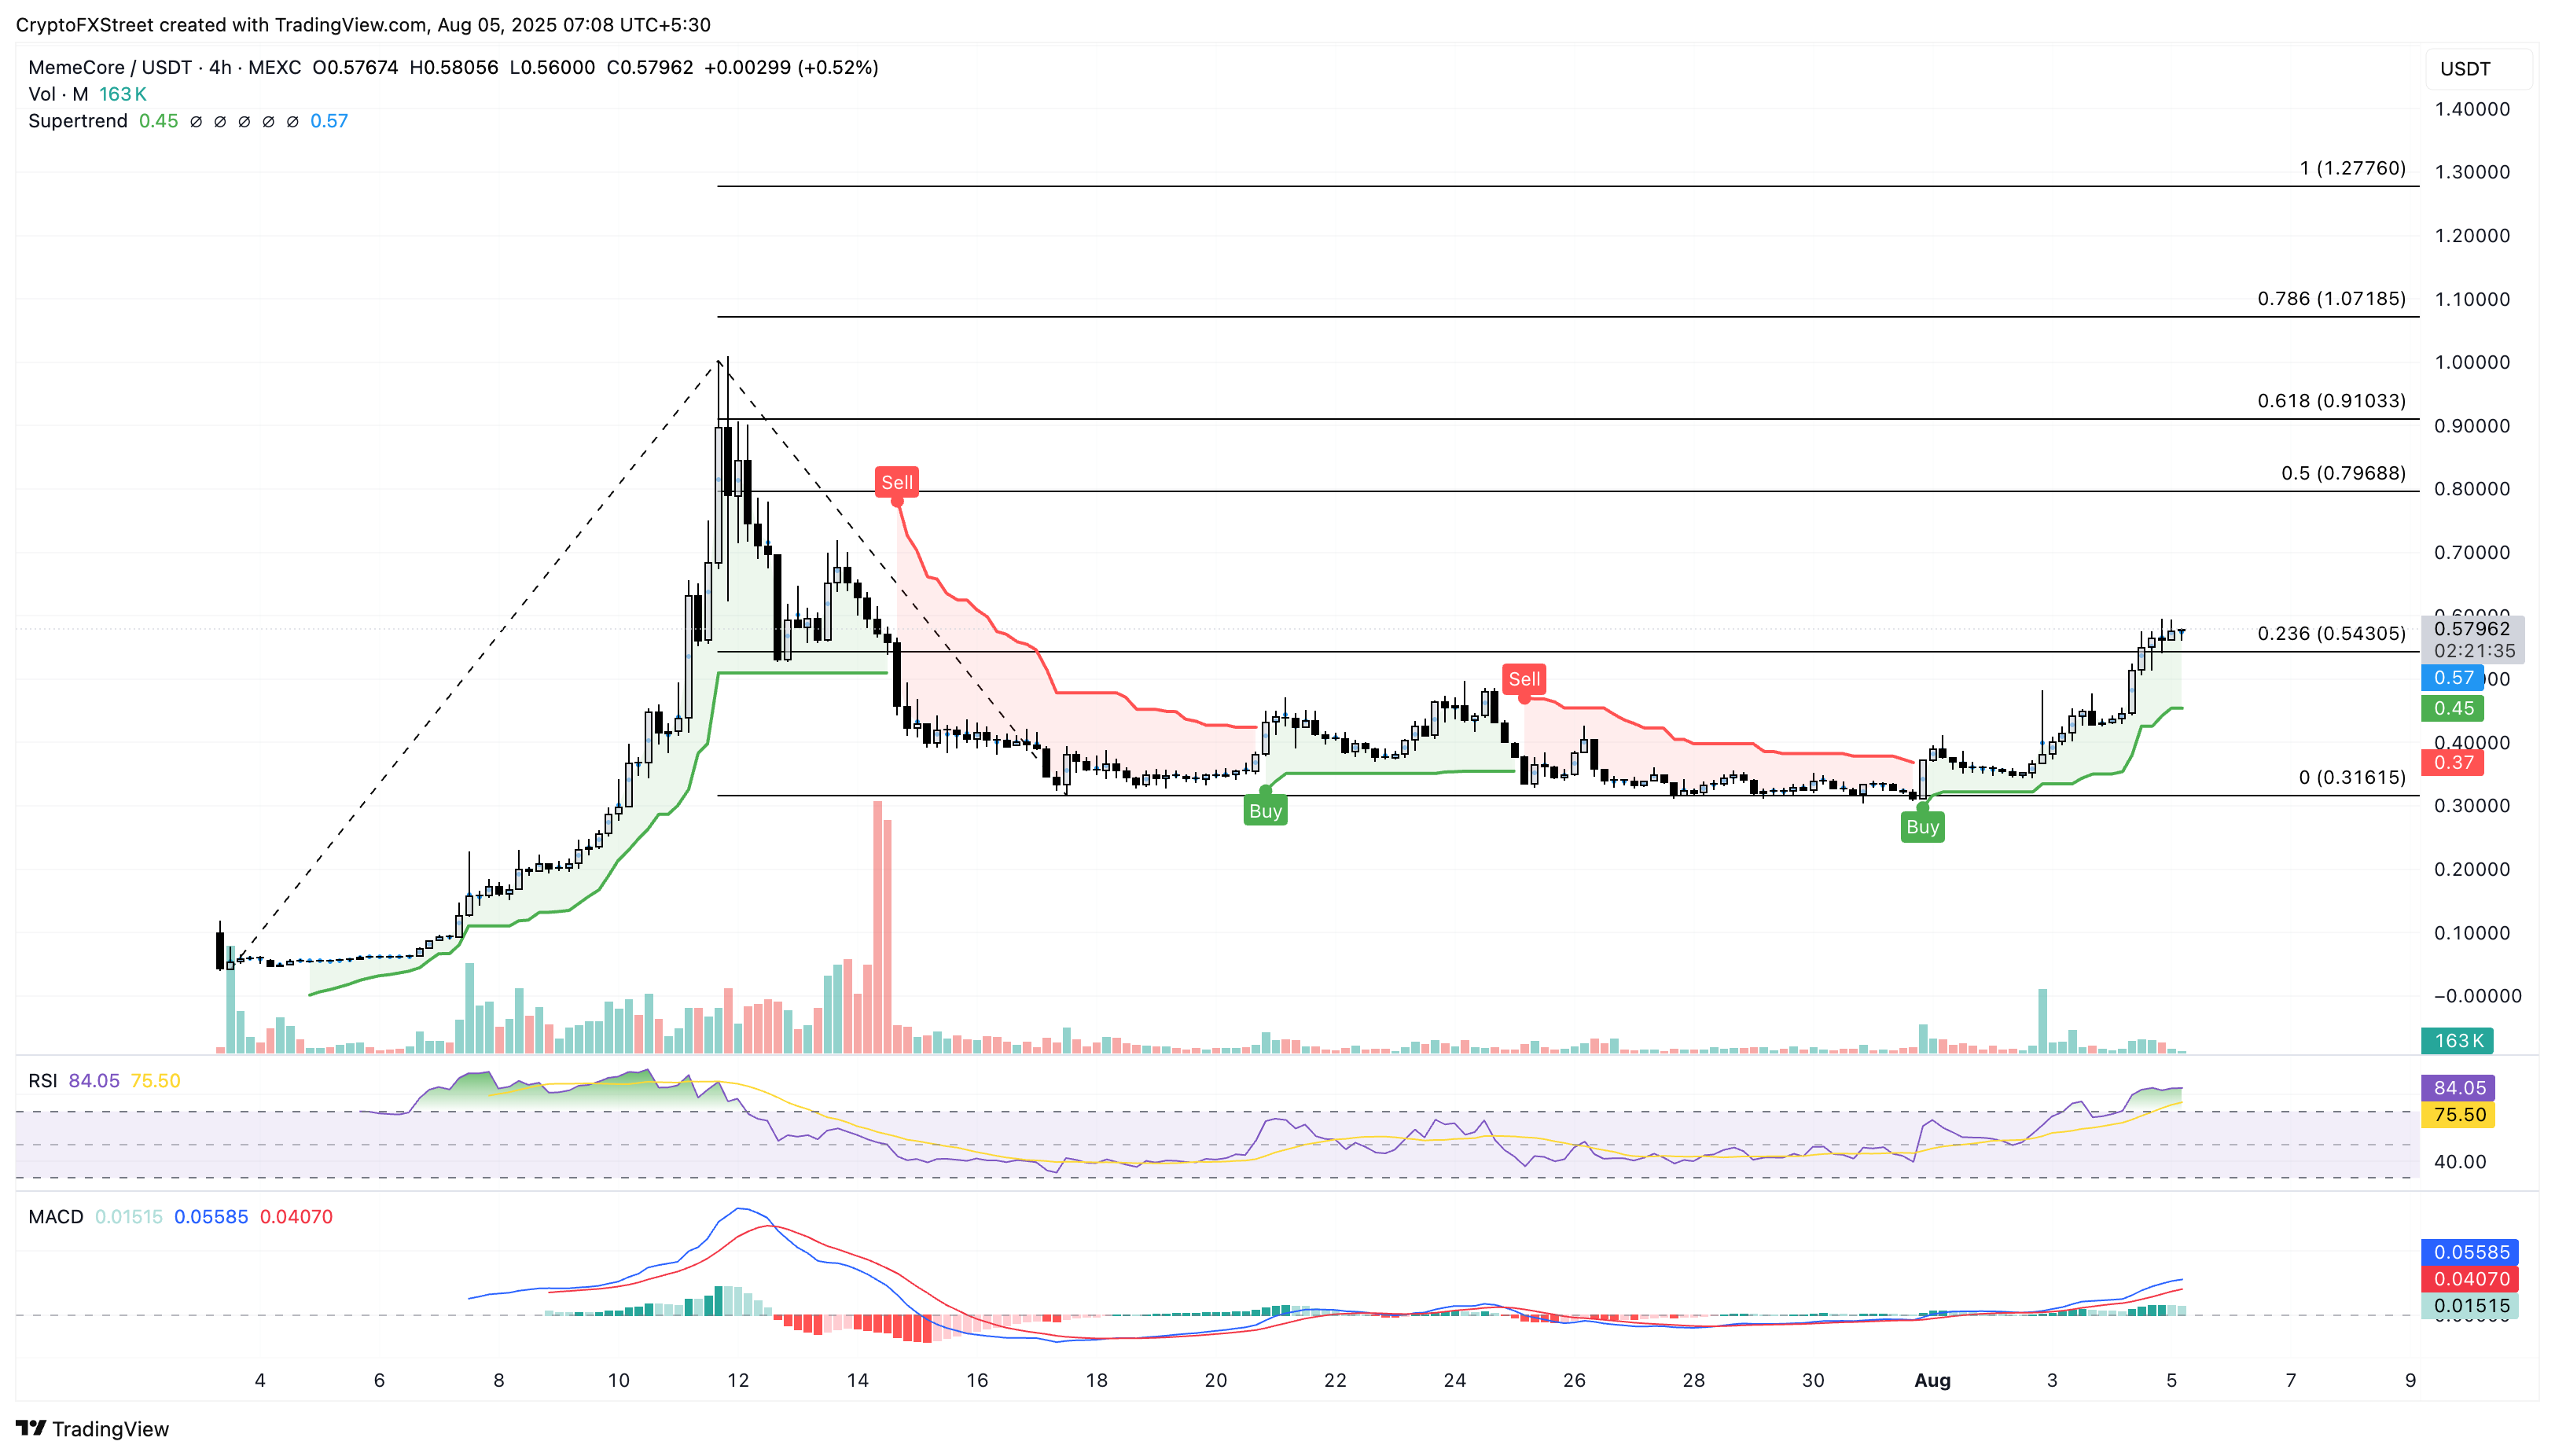
M/USDT daily price chart.
On the downside, a reversal below the $0.5430 level could extend the decline to $0.5000 support level.
Mantle eyes breakout rally as bullish momentum recovers
Mantle displays a massive rebound on the daily chart with a 19% jump on Monday, extending the 3% from Sunday. At the time of writing, MNT has edged lower by 2% so far on Tuesday, trading below the 50% retracement level at $0.8856, drawn from $1.41 on January 6 to $0.55 on July 1.
Investors may consider the Golden Cross between the 50 and 100-day Exponential Moving Averages (EMAs) as a buy signal, indicating that the short-term recovery has outpaced the medium-term trend.
The momentum indicators point to a bullish tilt on the daily chart as the RSI upticks to 60 with room for growth, and the MACD line manifests a crossover above its signal line.
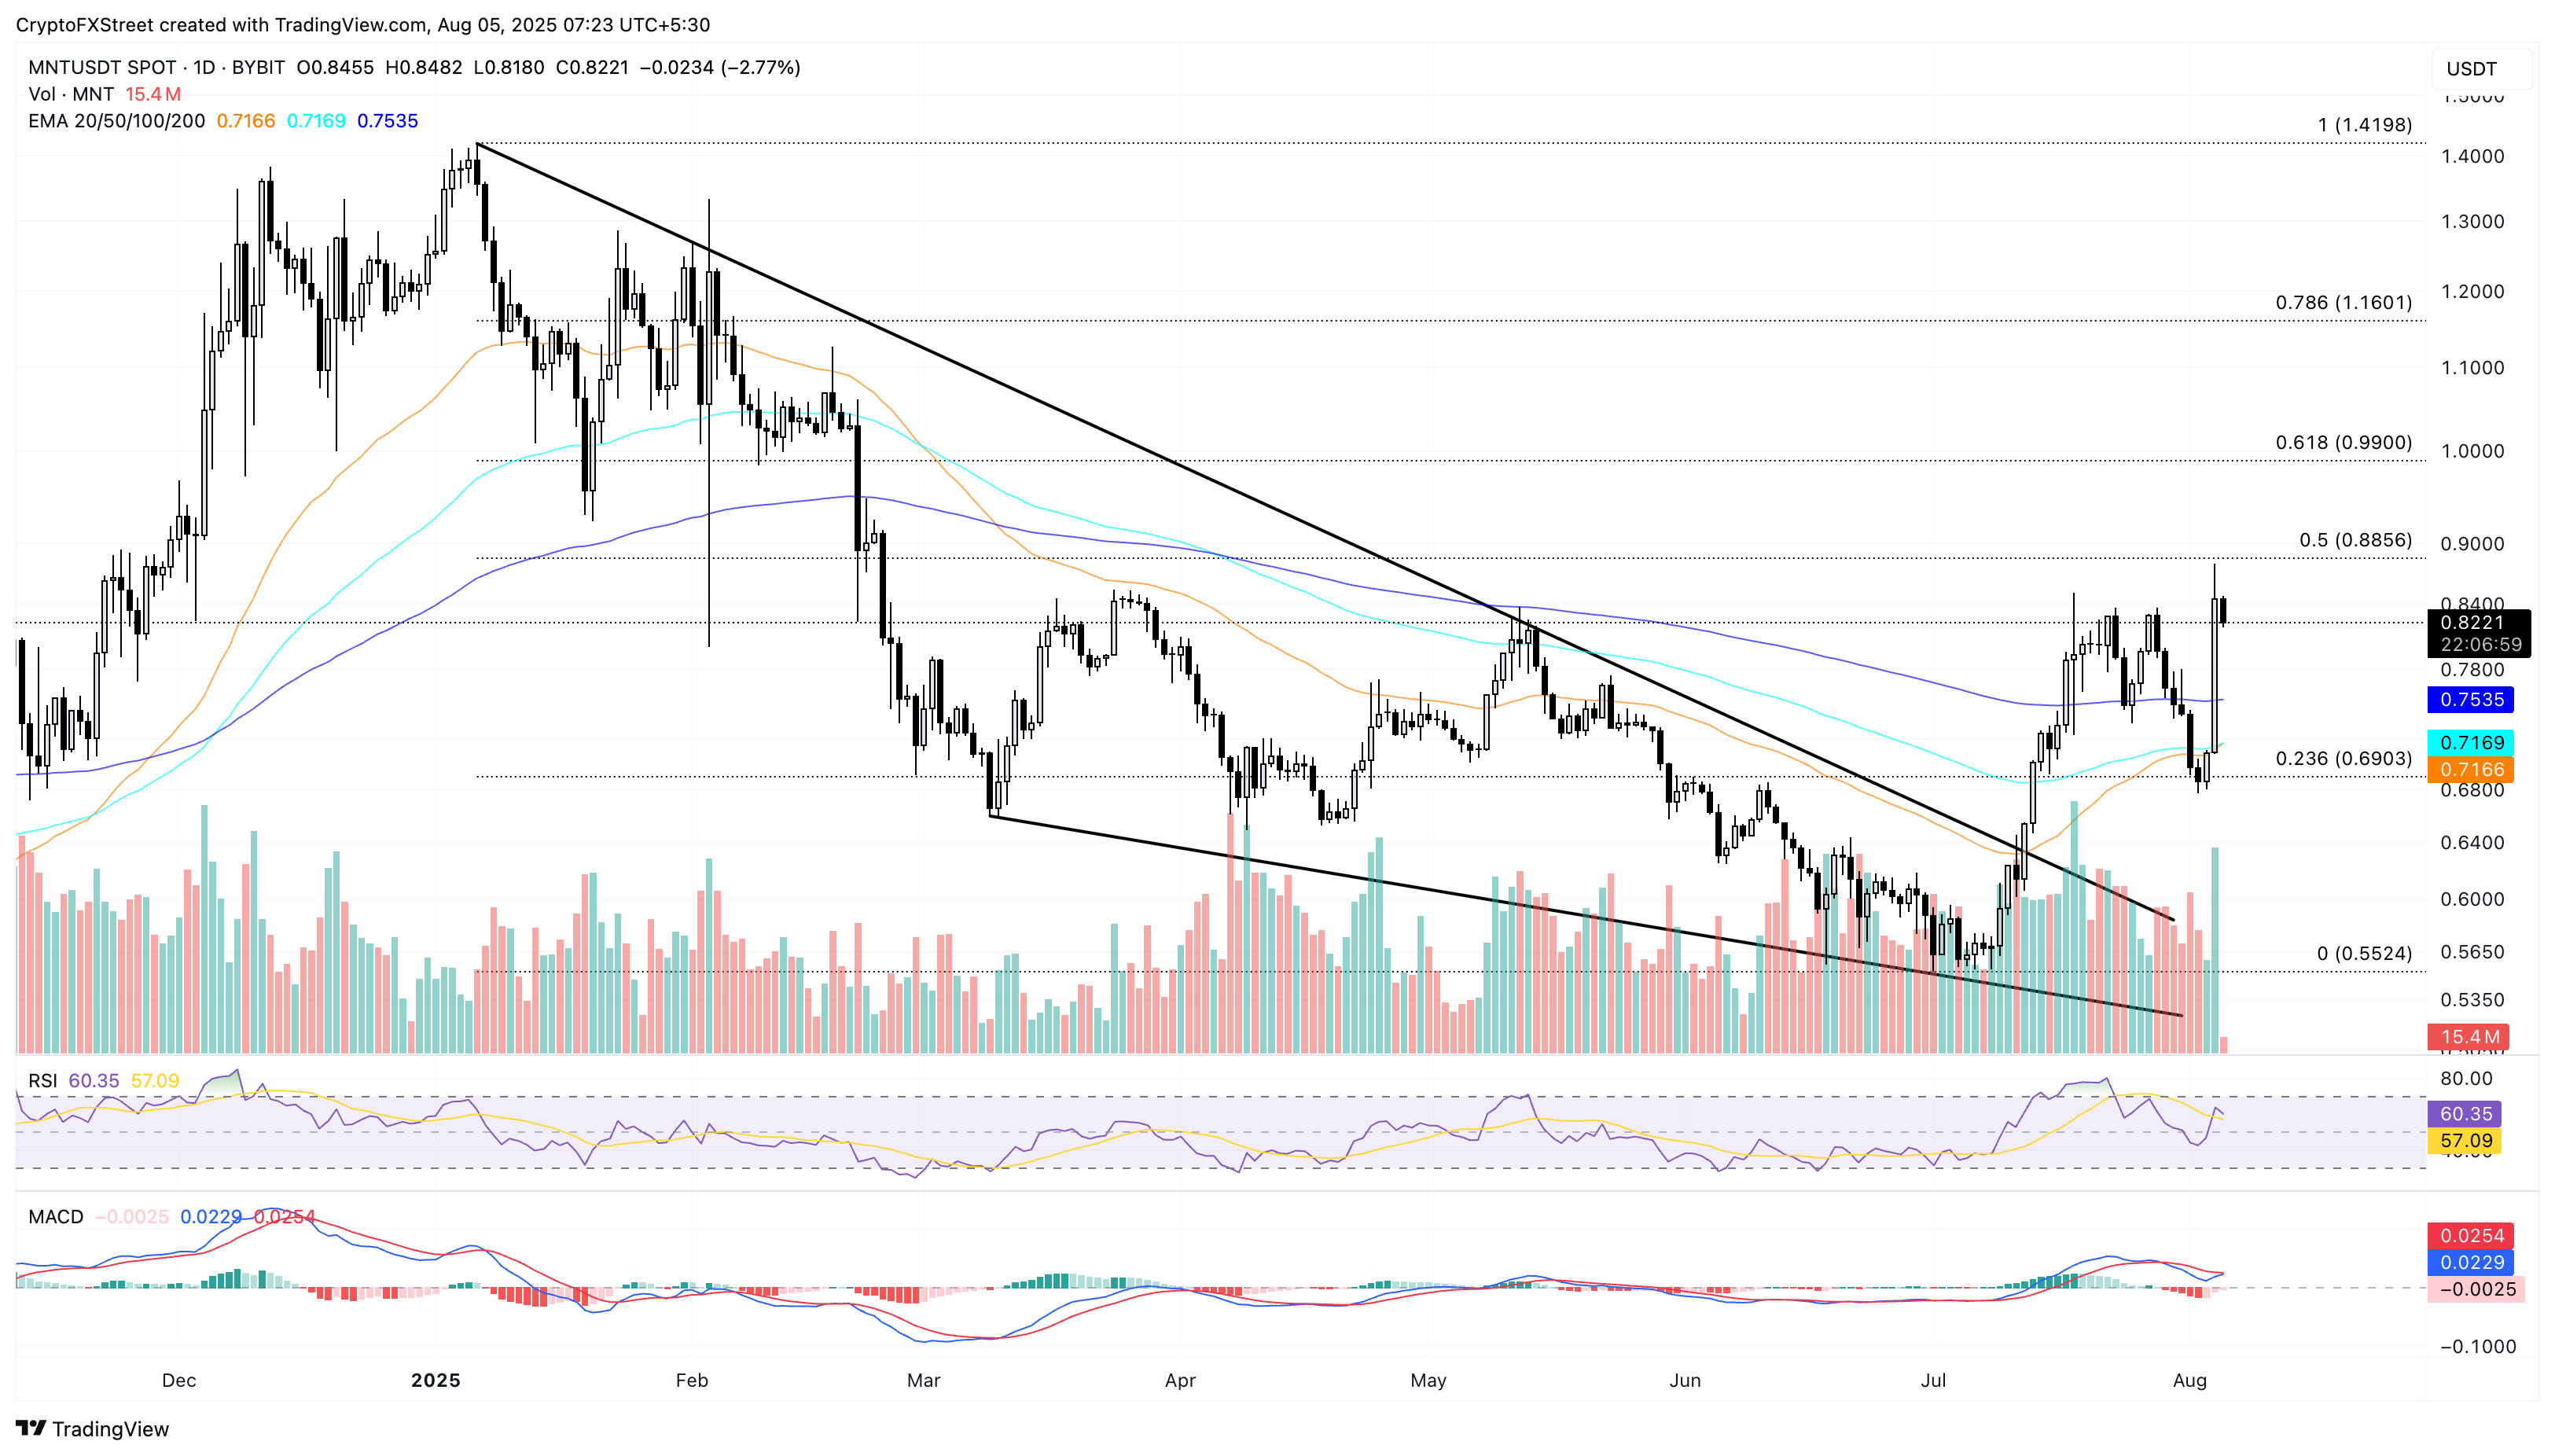
MNT/USDT daily price chart.
Looking down, a reversal in Mantle could extend the decline to the 200-day EMA at $0.75.
Litecoin hits five-month high, targeting $146
Litecoin edges higher by nearly 2% at press time on Tuesday, extending the nearly 10% gains from Monday. The reversal rally hits the highest level since March 3, surpassing the 78.6% Fibonacci level at $122 drawn from $146 on December 5 to $63 on April 7.
Investors could increase their exposure to LTC with a decisive close above $122, potentially extending the rally to the $147 peak. Furthermore, the MACD and signal line are on the verge of giving a crossover, which would flash another buy signal.
Still, the RSI on the daily chart reads 70, indicating that it has reached the overbought boundary, which risks a potential reversal as buying pressure nears saturation.
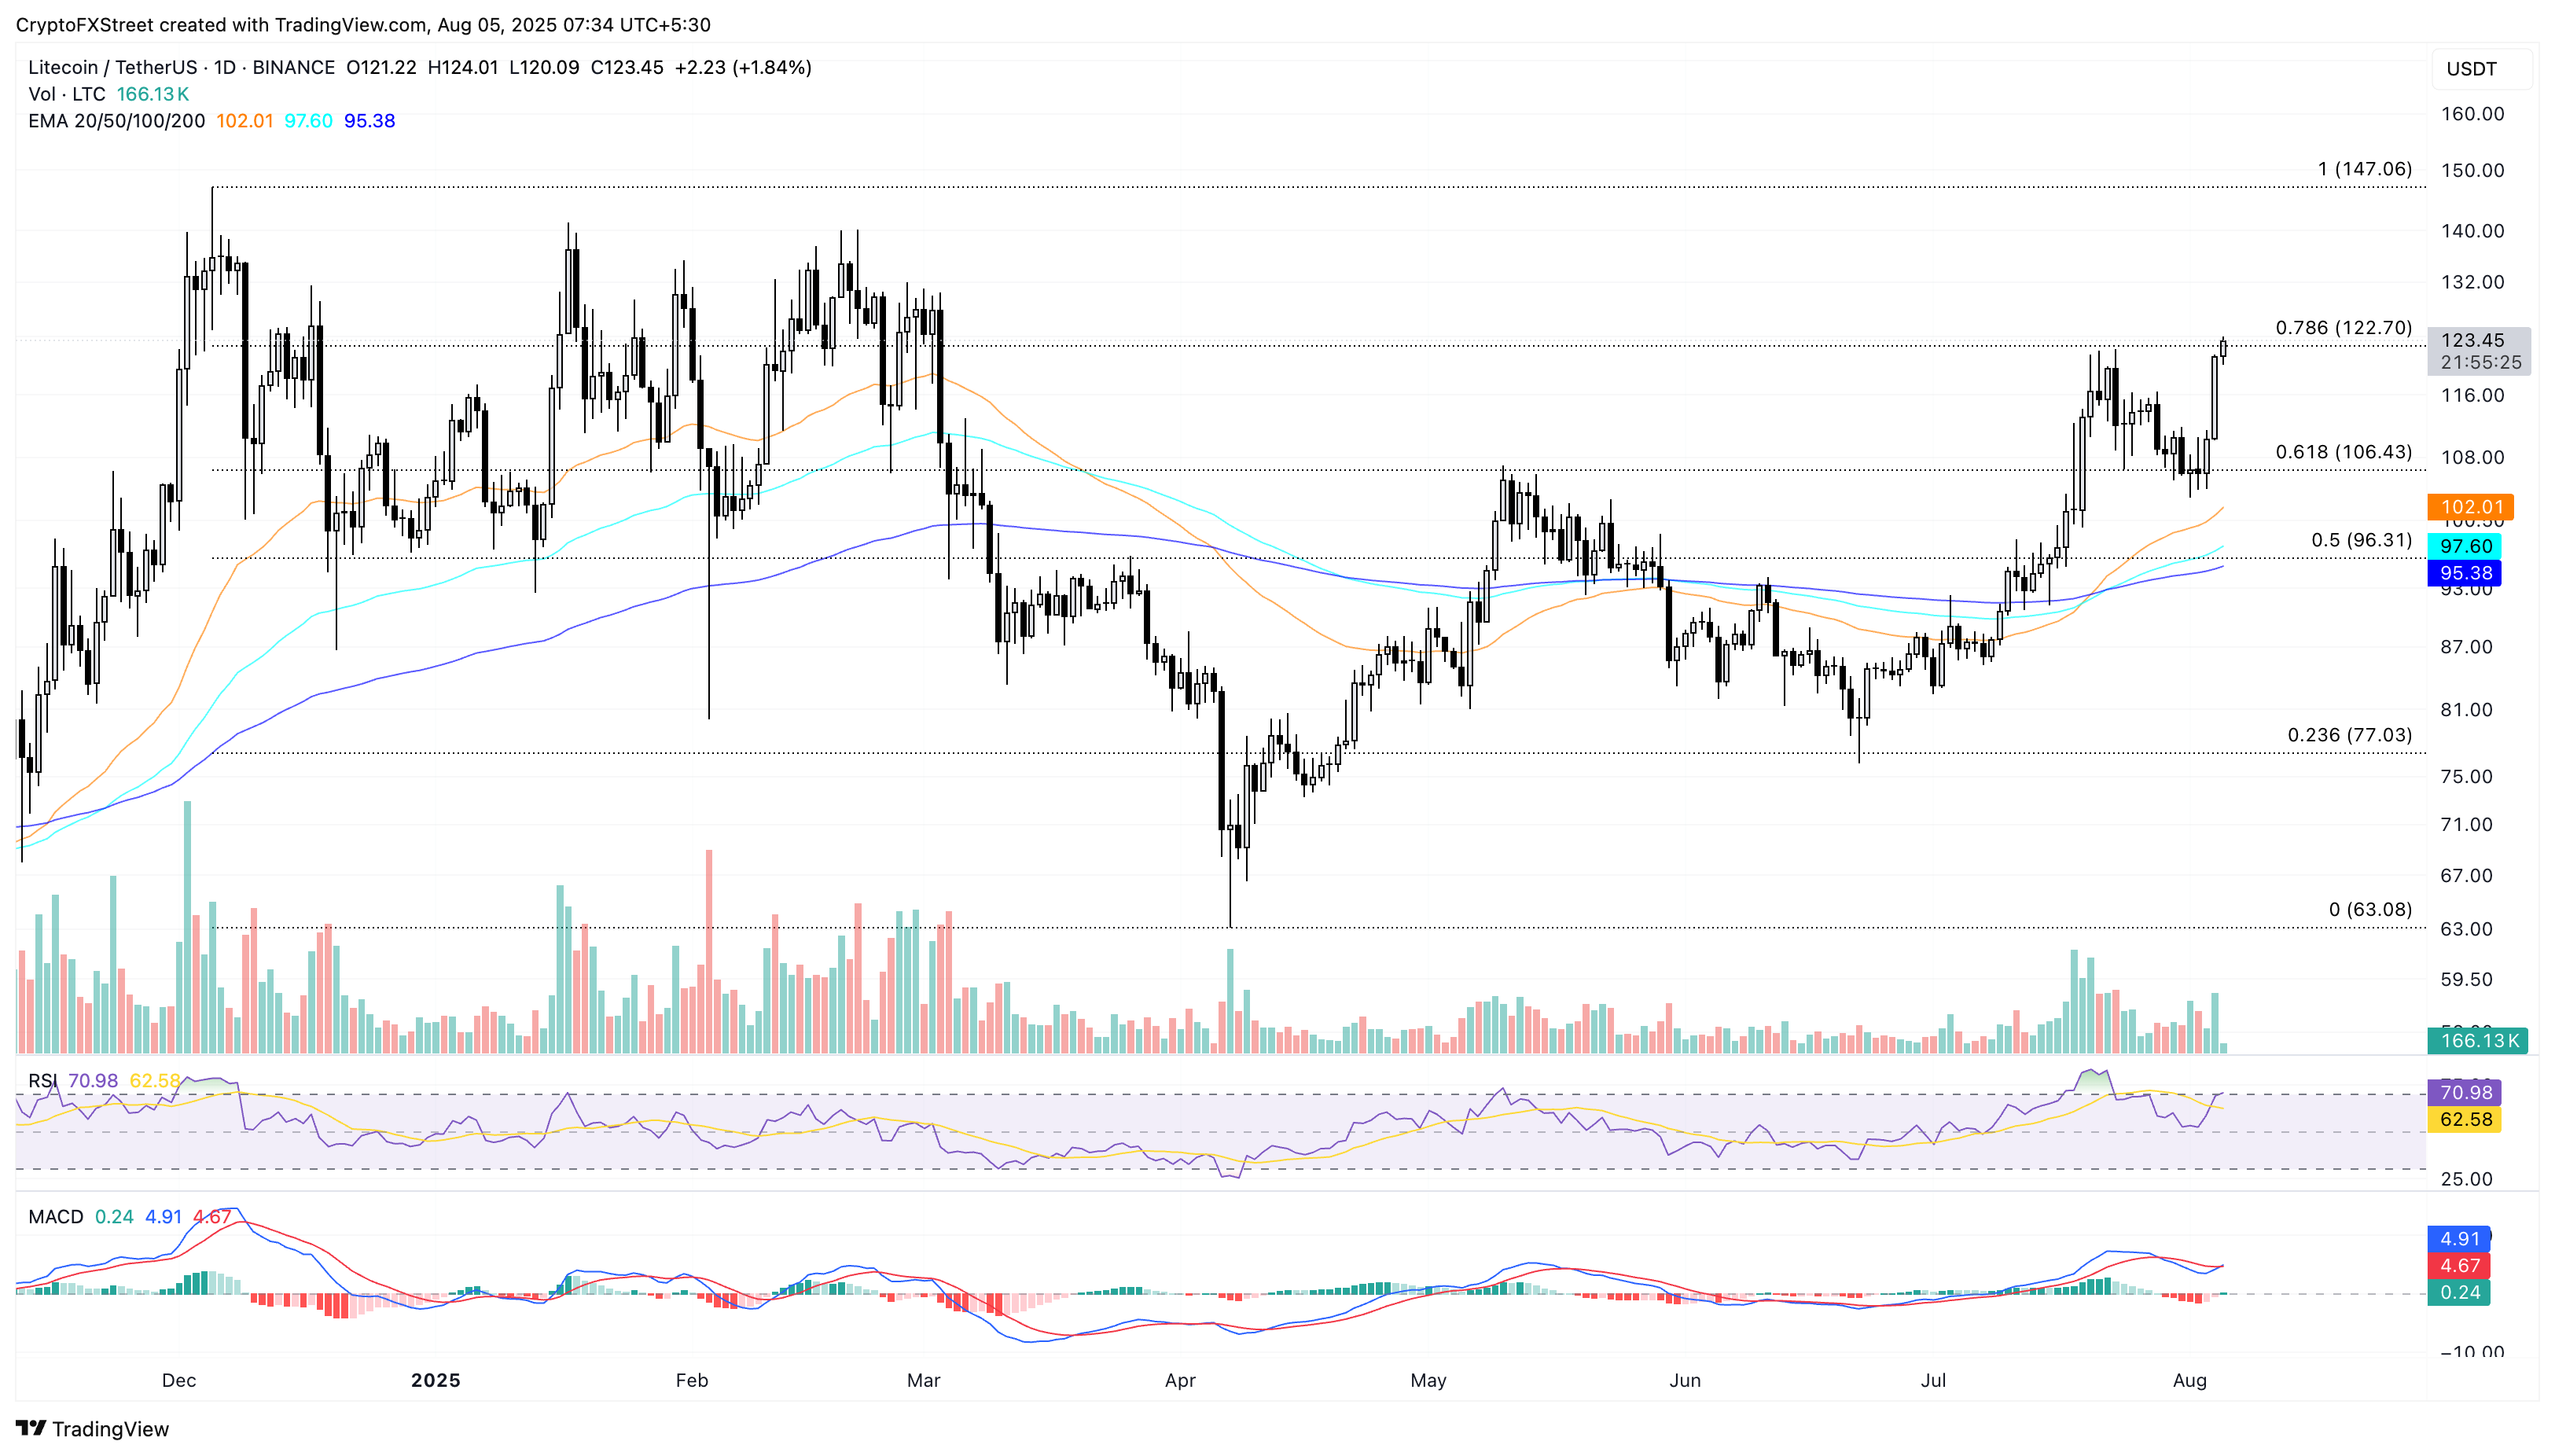
LTC/USDT daily price chart.
On the flipside, a reversal from the overhead resistance risks losing the recent gains with a retest of the 61.8% Fibonacci level at $106.