

SUI Price Forecast: SUI eyes further gains amid record high TVL, Open Interest

- Sui fluctuates indecisively at press time on Monday, consolidating the 4% gains from Sunday.
- The Total Value Locked on Sui hits a record high of $2.28 billion, indicating increased network activity.
- SUI Open Interest hits an all-time high of $2.66 billion, projecting heightened optimism among derivative traders.
Sui (SUI) edges lower by nearly 1% at press time on Monday, consolidating recent gains after reaching a six-month high of $4.44 earlier in the day, levels unseen since the Cetus hack in May. The bullish run backs the surge in Open Interest (OI) and Total Value Locked (TVL) on Sui to record high levels. The technical outlook reflects a battle against overhead supply pressure, as evidenced by the long wicks appearing on the daily candle.
SUI TVL records a new all-time high of $2.28 billion
DeFiLlama data shows that the TVL on the Sui network has reached a record high of $2.28 billion, up from $2.19 billion last week. A $90 million increase reflects a rising influx of users on the network willing to trade, stake, or avail other decentralized finance (DeFi) services on the network.
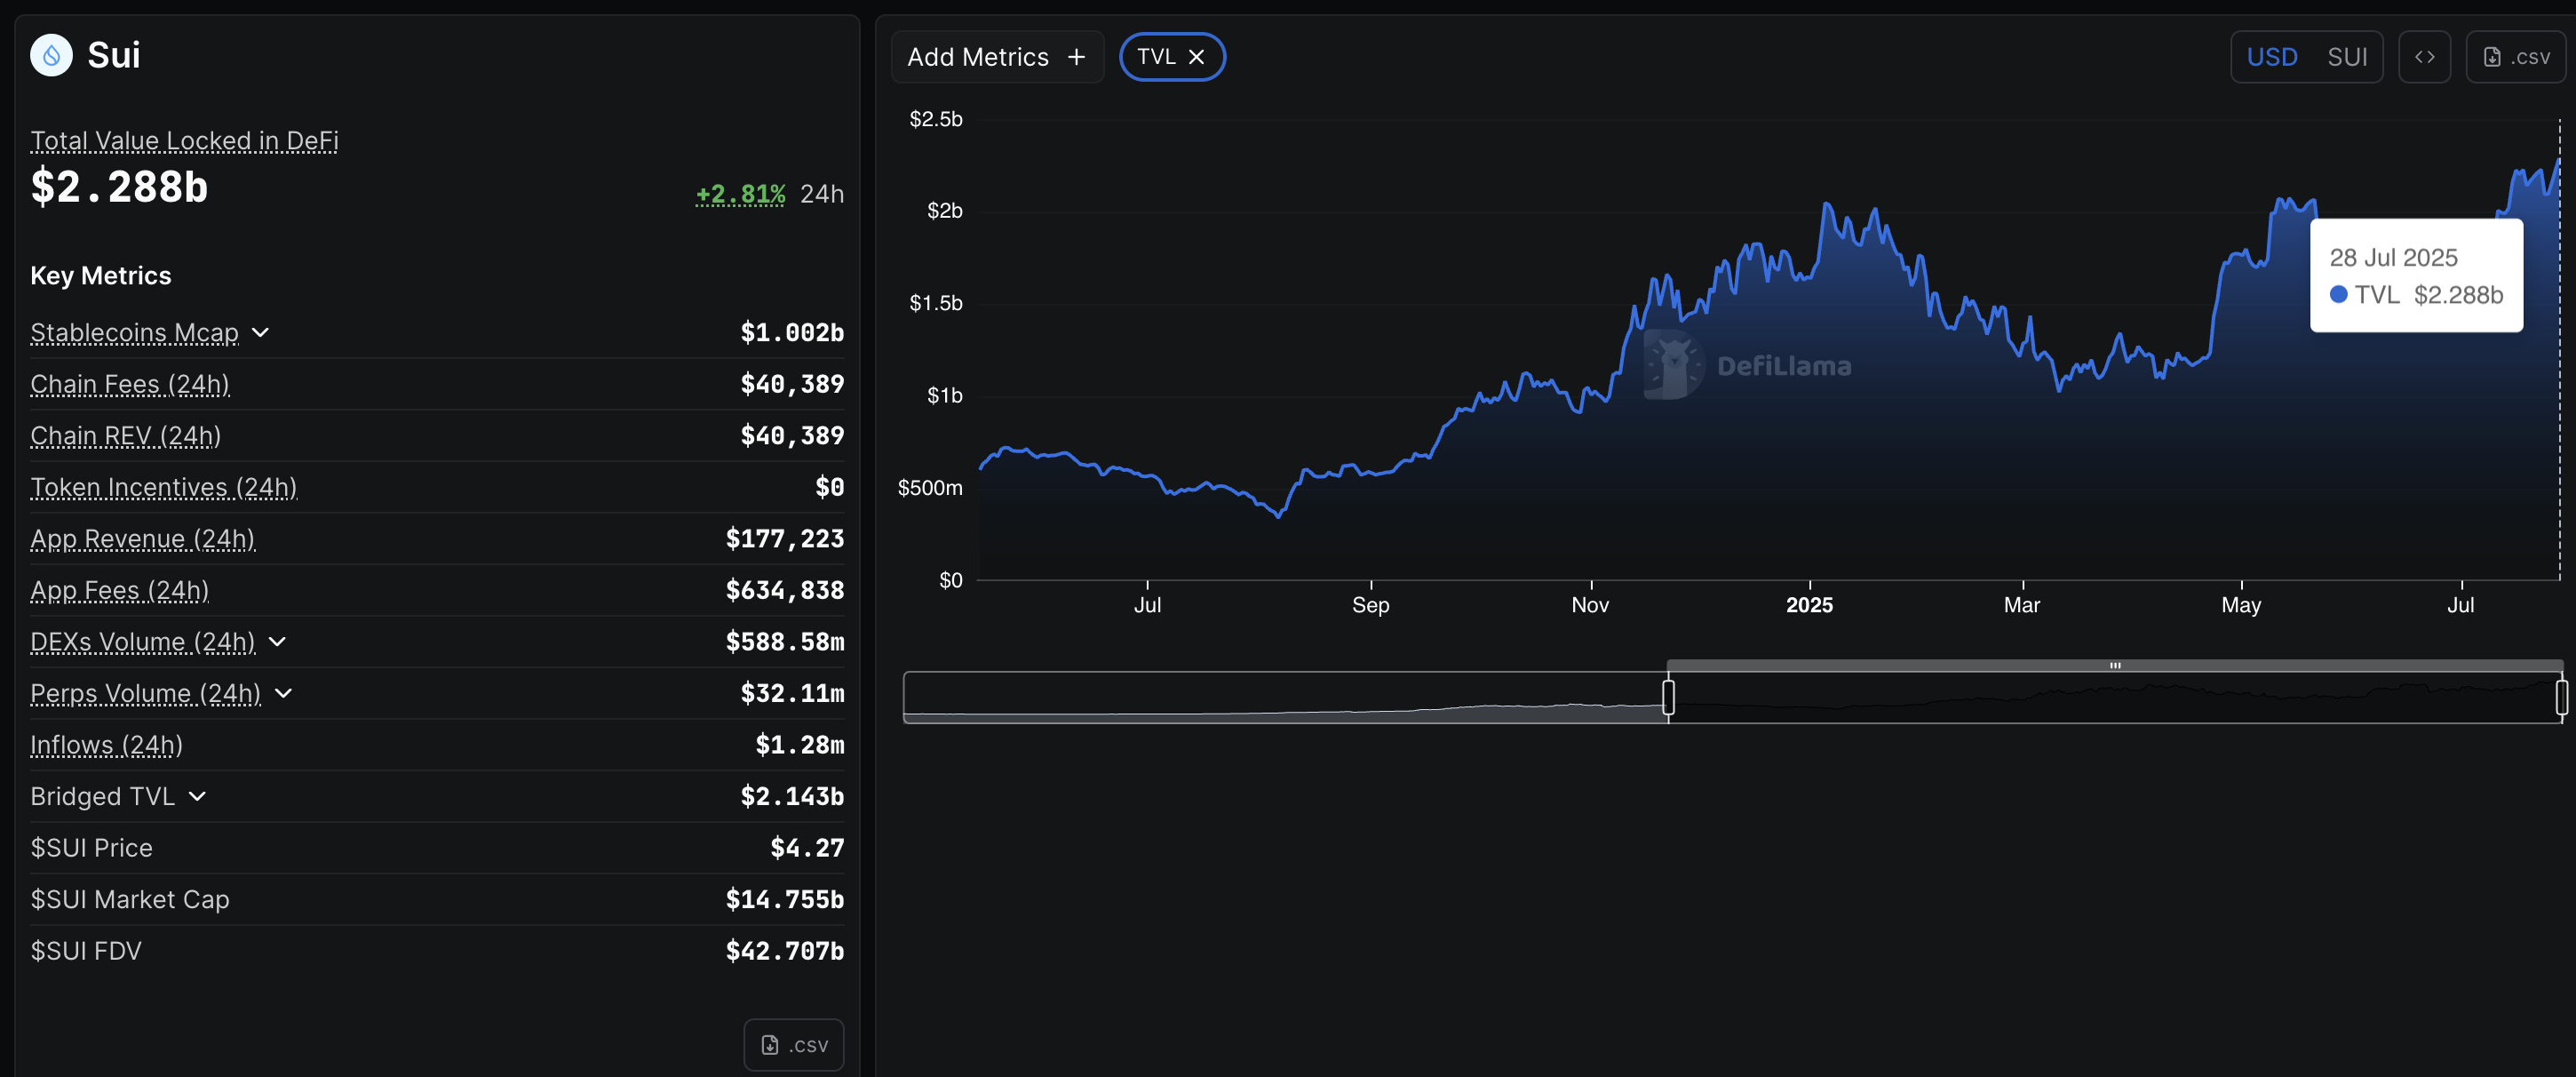
SUI TVL. Source: DeFiLlama
It is worth noting that the Stablecoin market capitalization on the network has crossed $1 billion, indicating increased liquidity.
Open Interest hits record high of $2.66 billion
Coinglass’s data displays the SUI Open Interest (OI) rising to $2.66 billion, up from $2.36 billion on Sunday. The $30 billion surge in the last 24 hours indicates a significant capital inflow, likely driven by rising interest among traders.
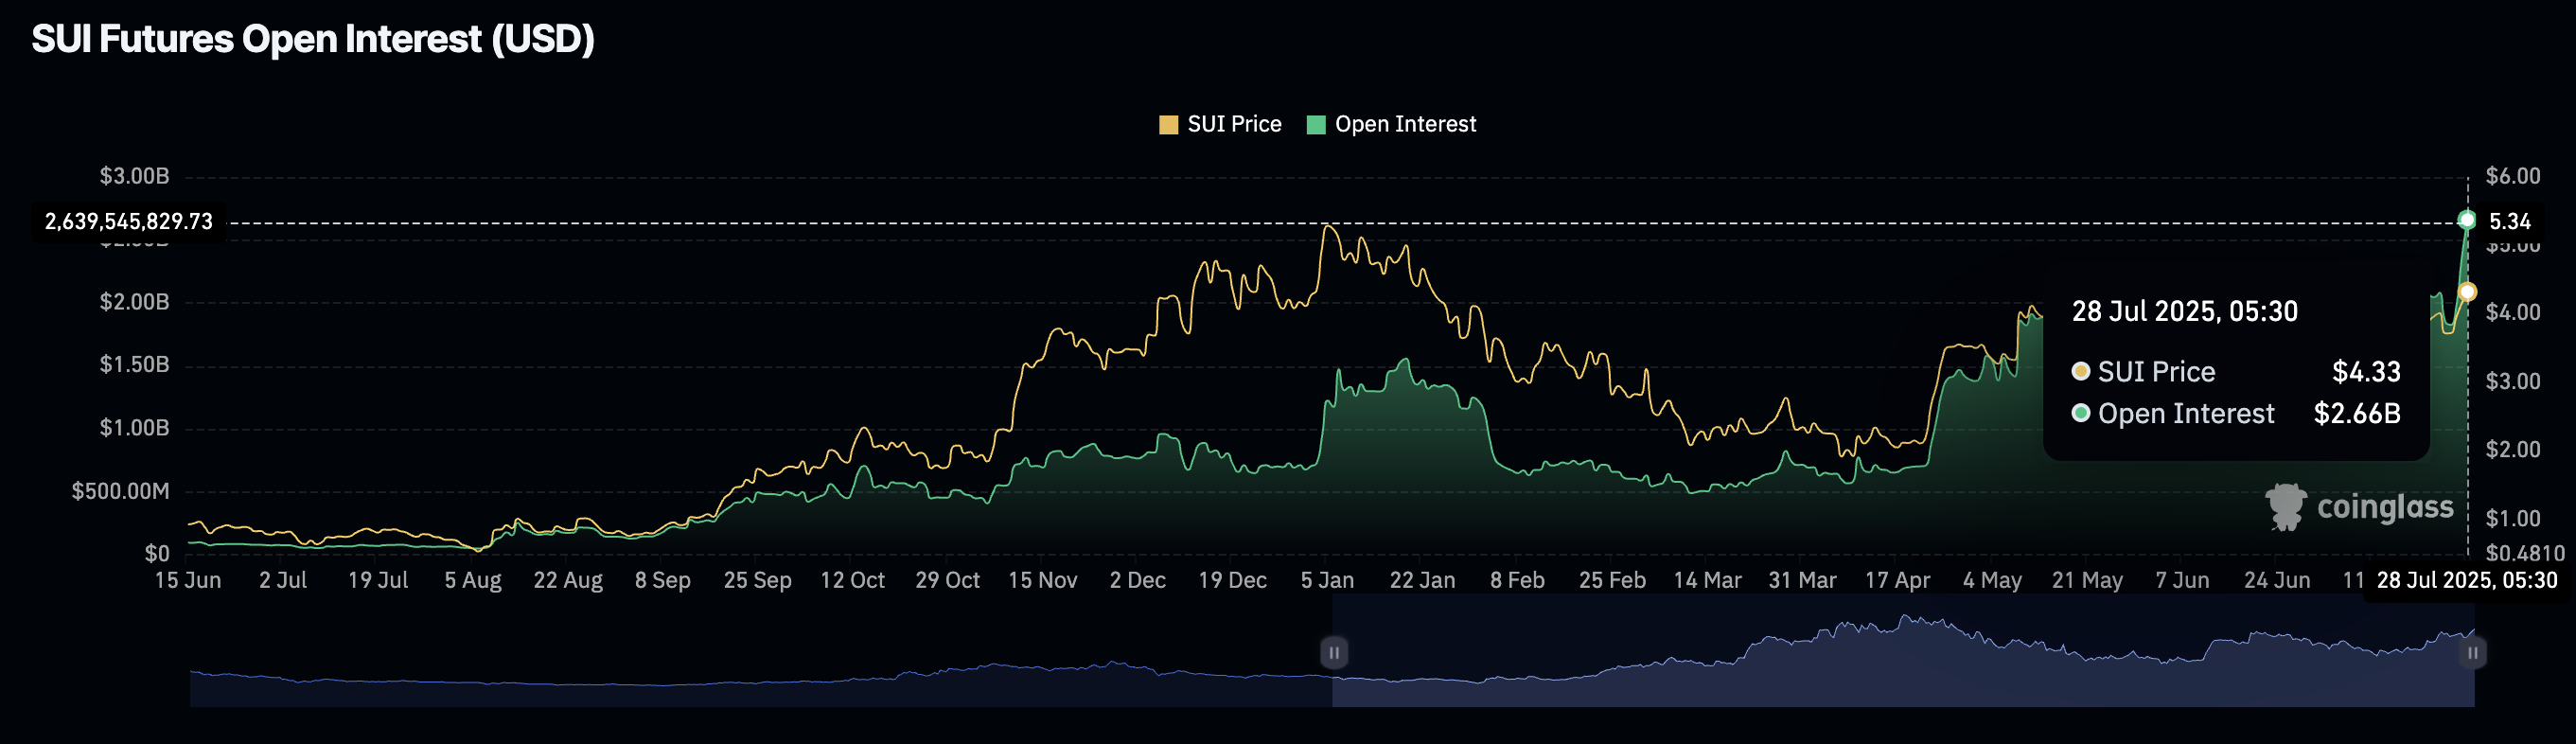
SUI Open Interest. Source: Coinglass
The OI-weighted funding rate stands at 0.0198%, up from 0.0129% on Sunday, indicating a greater boost in buying activity with the increased capital inflows. Typically, a spike in funding rate represents a surge in buying pressure as bulls pay the positive rates to keep the swap and spot prices aligned.
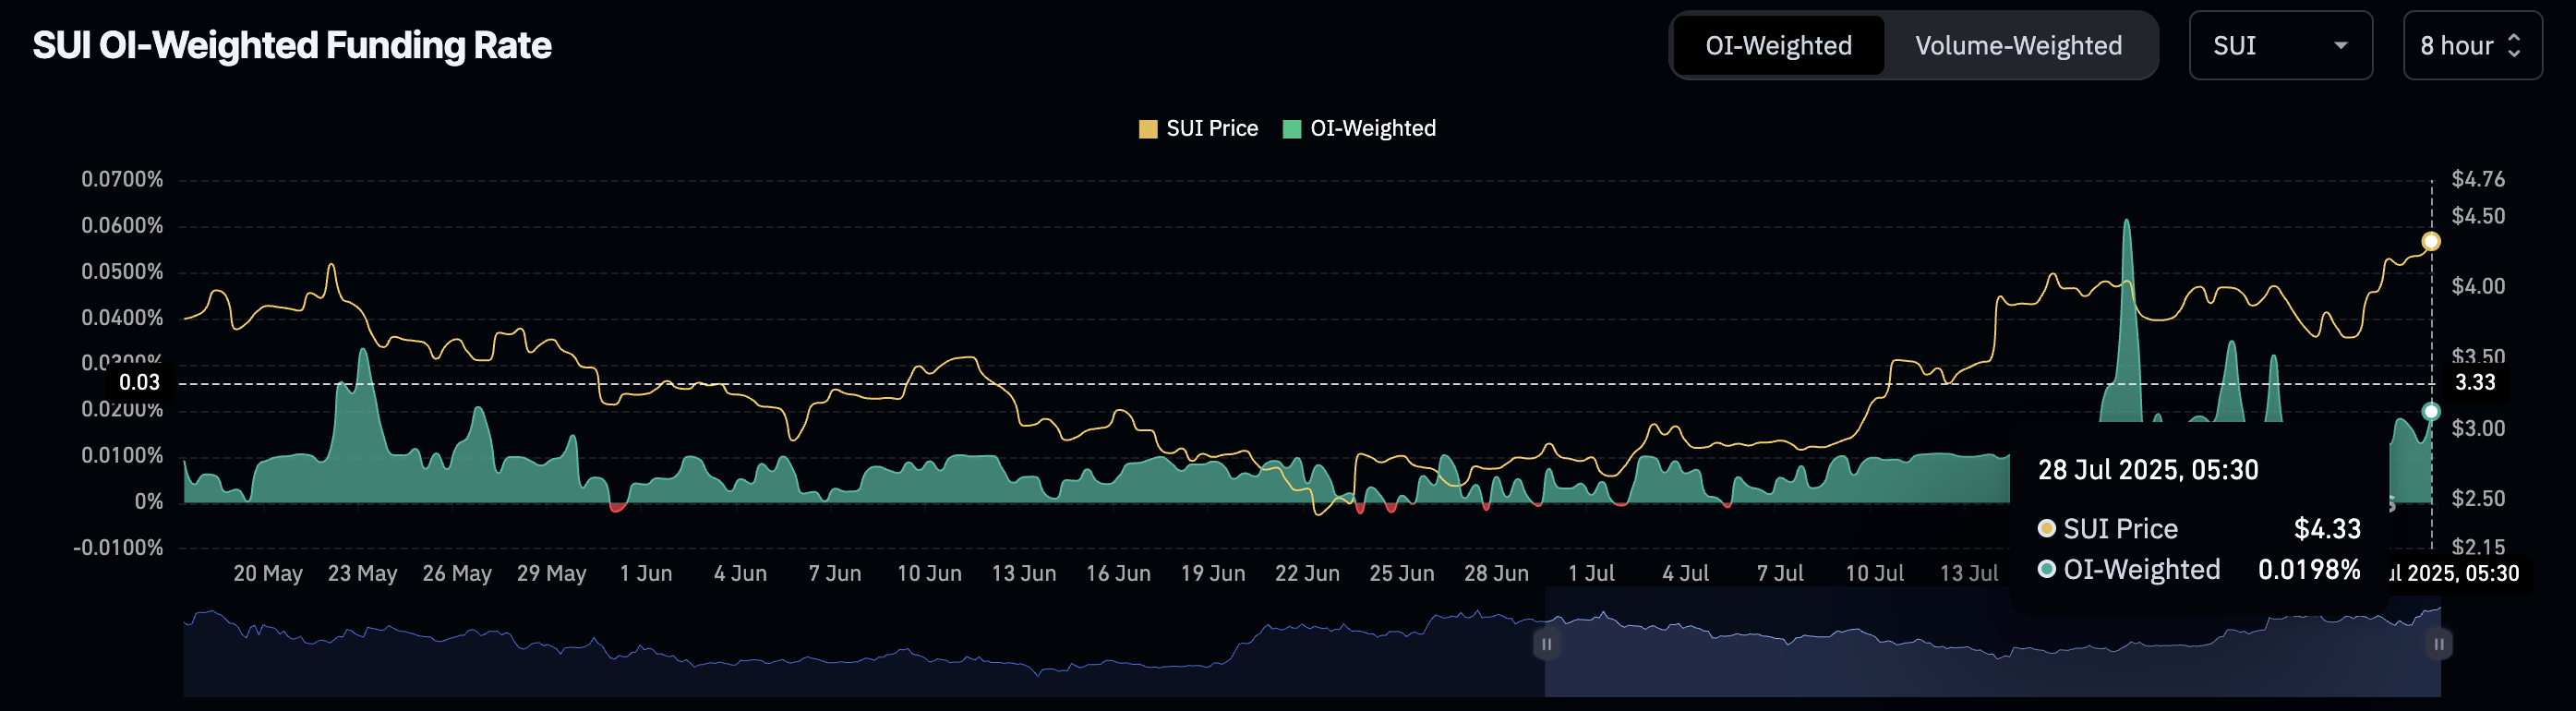
SUI funding rate. Source: Coinglass
SUI faces overhead selling pressure at six-month highs
SUI edges lower by nearly 1% so far on Monday after hitting $4.44 earlier in the day to mark a six-month high. The recent uptrend surpassing $4.29 marks a complete recovery from the Cetus hack in May.
However, the TVL and OI growth surpass the bullish run in spot prices, suggesting the boost in network activity and the derivative market’s optimism is yet to translate.
The intraday pullback could target the $4.00 round figure for a retest, potentially extending to the 50% Fibonacci retracement at $3.54, drawn from the $5.36 peak on January 6 to the $1.71 low on April 7.
The Relative Strength Index (RSI) reads 65 on the daily chart as it faces downside pressure. Notably, the RSI shifts lower, diverging from the rising SUI price trend, which indicates a potential hidden bearish divergence. Investors may want to temper their bullish expectations, as the said divergence often foreshadows a quick correction.
The Moving Average Convergence Divergence (MACD) bounces off its signal line with a surge in green histogram bars from the zero line, indicating the bulls are battling against a trend reversal.
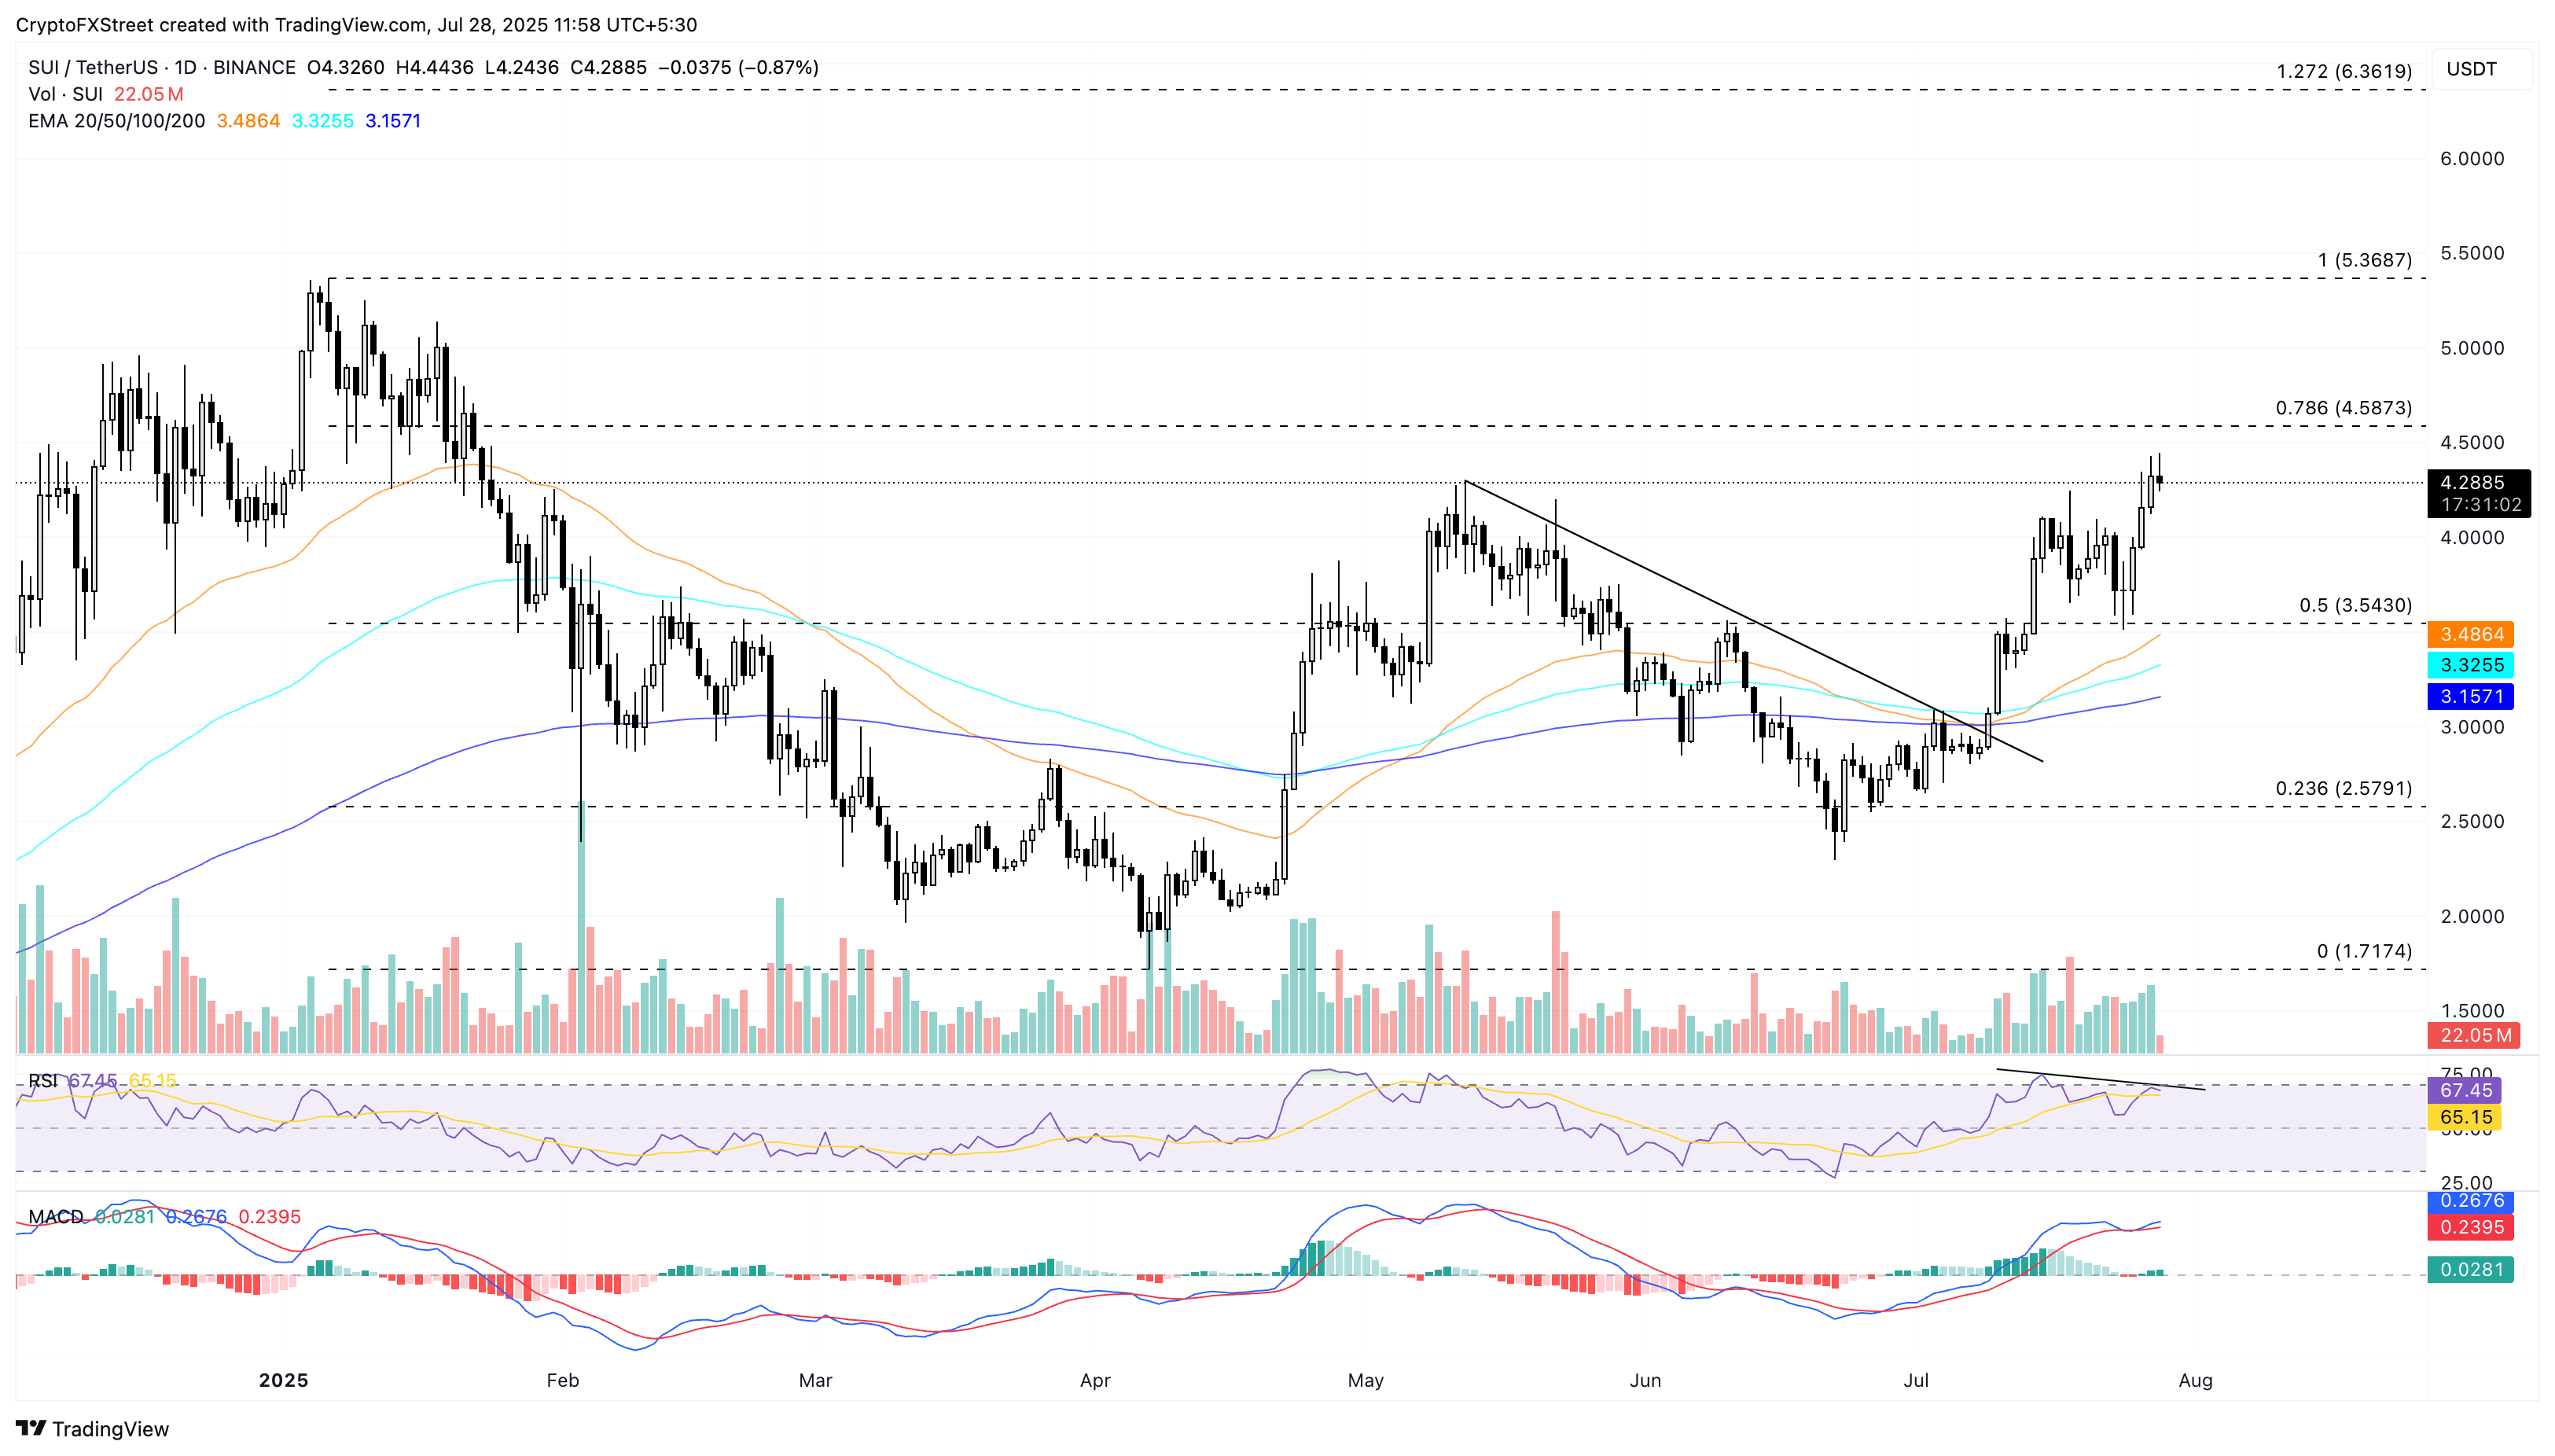
SUI/USDT daily price chart.
If SUI upholds bullish momentum, it could extend the rally to the 78.6% Fibonacci level at $4.58. A potential close above this level would increase the chances of SUI reclaiming the $5 milestone.
Related Articles
Amazon Stock Predictions for 2026 to 2030: Will They Exceed Expectations and Achieve Major Long-Term Goals?
TradingKey - As we head into 2026, many investors are questioning where Amazon (AMZN) fits into the technology world.
A Crash After a Surge: Why Silver Lost 40% in a Week?
TradingKey - Spot silver (XAGUSD) prices continue to decline. Silver plunged 20% on Thursday, breaking below $71 per ounce, with the sell-off intensifying on Friday as prices fell further below $64. Compared to the all-time high set on January 29, silver prices have retraced more than 40%, wiping out nearly all gains accumulated over the previous month.
Is Bitcoin’s Four-Year Cycle Dead in 2026?
Is the Bitcoin 4-year cycle dead? After 2025 broke historical records with a red post-halving year, institutional analysts explore if the Bitcoin price has decoupled from the halving countdown. Analyze the impact of spot ETFs, global liquidity, and the roadmap to the 2028 halving in this 2026 market
USD Dollar Trend Forecast: Dollar Index Falls Below 97.0 to 4-Year Low, Will the Dollar Continue To Fall or Bottom Out in 2026?
TradingKey - In January 2026, the US Dollar Index continued its downward trend from 2025, officially breaking below the key 97.0 level and reaching a low of 95.5, marking a nearly four-year low since February 2022.

