

Bonk Price Forecast: BONK rallies as OI hits yearly high, LetsBonk.fun tops Solana launchpad revenue

- Bonk price extends its gains on Tuesday after rallying almost 20% the previous week.
- Data shows that BONK’s launchpad has collected the highest weekly revenue, and its open interest reaches a yearly high.
- The technical outlook suggests a rally continuation, with bulls eyeing the $0.000034 resistance as the next key target.
Bonk (BONK) continues its bullish momentum, extending gains, trading around $0.000027 on Tuesday after rallying almost 20% the previous week. On-chain and derivatives data paint a bullish picture as BONK’s launchpad has collected the highest weekly revenue, and Open Interest (OI) reaches its yearly high, suggesting growing confidence among traders. The technical analysis supports further upside, targeting the $0.000034 mark in the near term.
BONK’s Open Interest hits yearly high
Coinglass’ data shows that the futures’ OI in BONK at exchanges rose to $507.50 million on Tuesday from $393.80 million on Saturday, the highest yearly level not seen since December 9. An increasing OI represents new or additional money entering the market and new buying, which could fuel the current Bonk price rally.
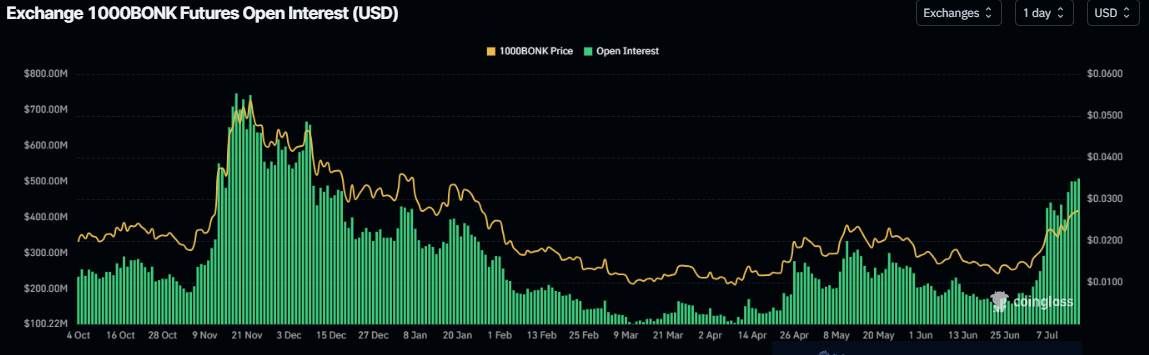
Bonk Open Interest chart. Source: Coinglass
The chart below shows that for the first time, Bonk’s launchpad letsbonk.fun has flipped all other Solana launchpads’ weekly revenue combined as it collects $7.97 million in revenue, further bolstering the bullish outlook.
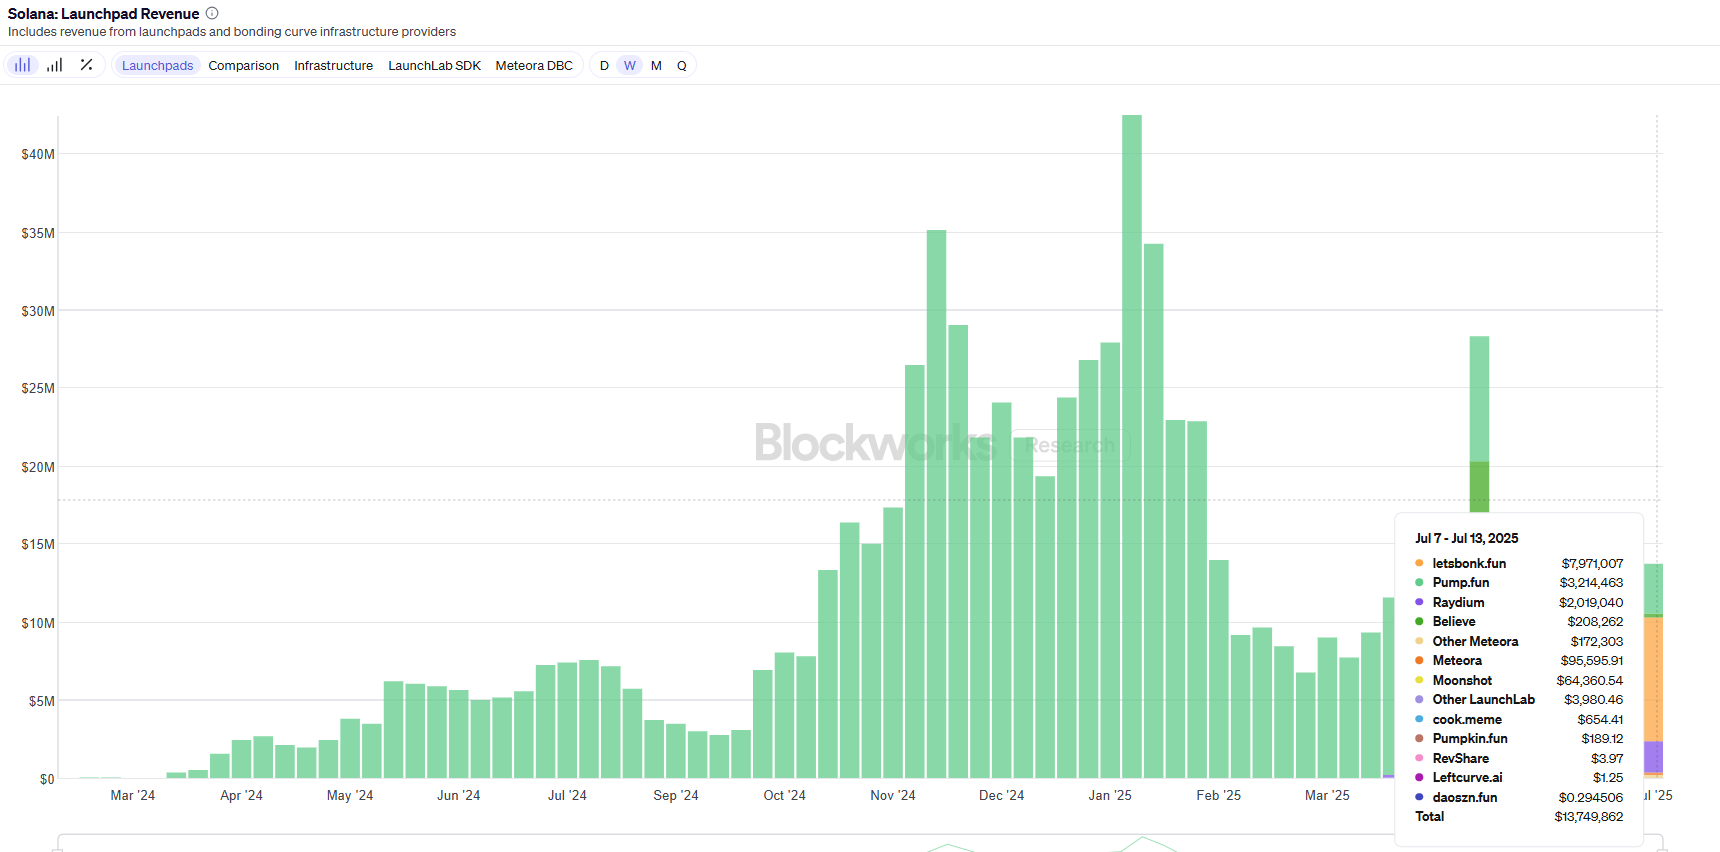
Solana’s launchpad weekly revenue chart. Source: Blockworks
Bonk Price Forecast: BONK breaks above the key resistance level
Bonk price broke above the daily resistance level at $0.000024 on Saturday and rallied 6.4% in the next two days. At the time of writing on Tuesday, it continues its upward trend, trading above $0.000027.
If the daily level at $0.000024 holds as support, BONK could extend the rally to retest its weekly resistance at $0.000034.
The Relative Strength Index (RSI) on the daily chart reads 74, above its overbought level of 70, indicating strong bullish momentum. However, traders should be cautious as the chances of a pullback are high due to its overbought condition. Meanwhile, the Moving Average Convergence Divergence (MACD) indicator displayed a bullish crossover at the end of June. It also shows rising green histogram bars above its neutral zero line, suggesting bullish momentum is gaining traction and continuing an upward trend.
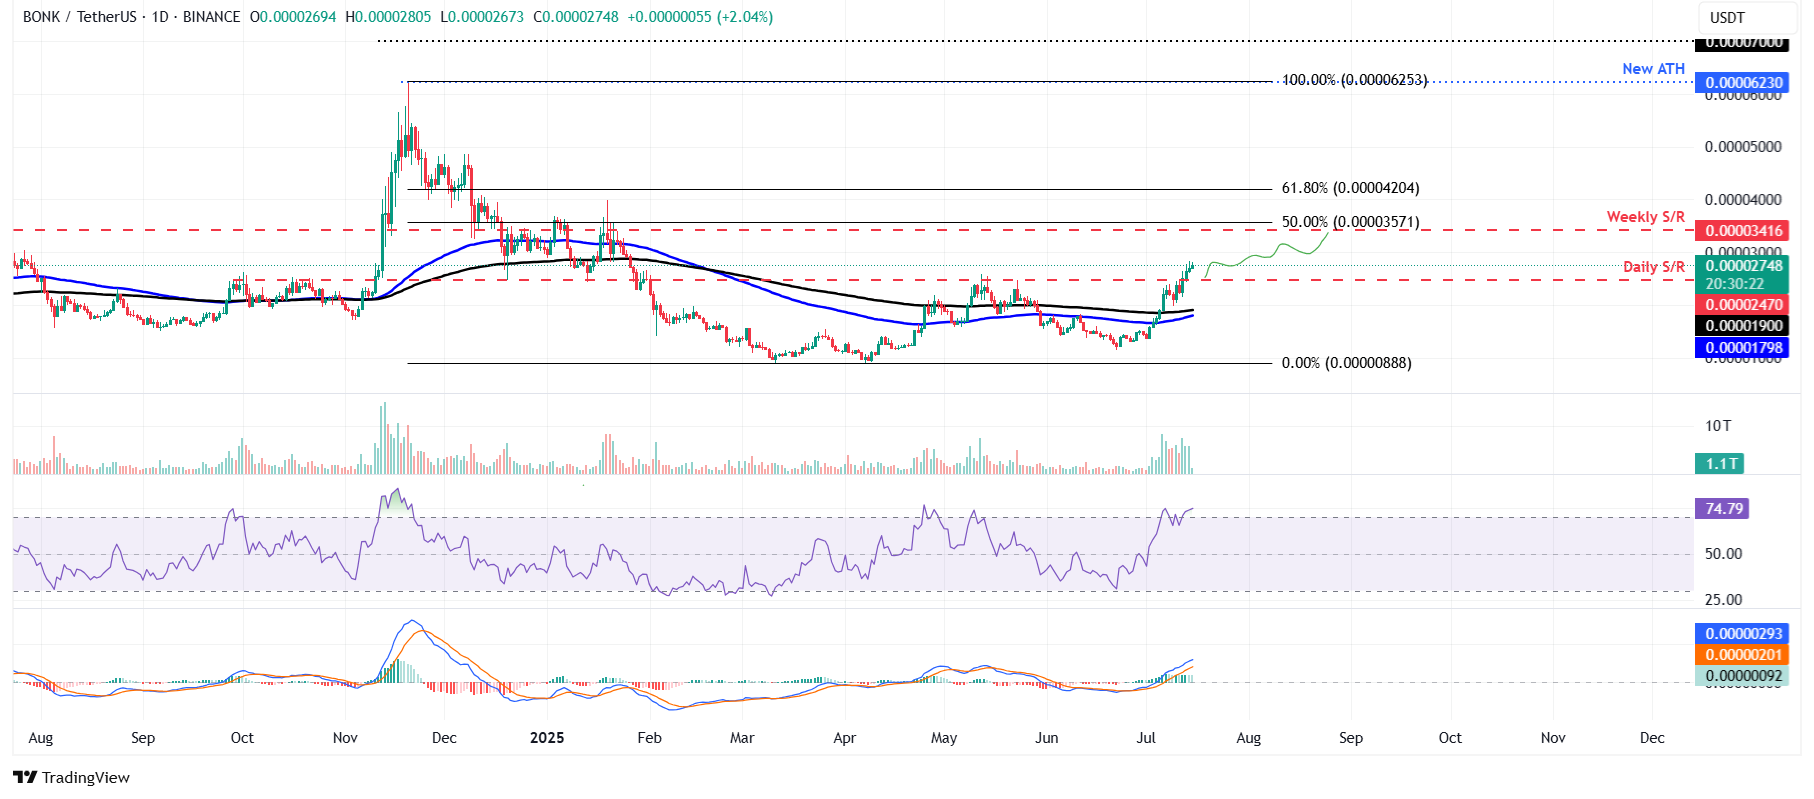
BONK/USDT daily chart
However, if BONK faces a correction, it could extend the decline to find support around its daily level at $0.000024.
Related Articles
Amazon Stock Predictions for 2026 to 2030: Will They Exceed Expectations and Achieve Major Long-Term Goals?
TradingKey - As we head into 2026, many investors are questioning where Amazon (AMZN) fits into the technology world.
A Crash After a Surge: Why Silver Lost 40% in a Week?
TradingKey - Spot silver (XAGUSD) prices continue to decline. Silver plunged 20% on Thursday, breaking below $71 per ounce, with the sell-off intensifying on Friday as prices fell further below $64. Compared to the all-time high set on January 29, silver prices have retraced more than 40%, wiping out nearly all gains accumulated over the previous month.
Is Bitcoin’s Four-Year Cycle Dead in 2026?
Is the Bitcoin 4-year cycle dead? After 2025 broke historical records with a red post-halving year, institutional analysts explore if the Bitcoin price has decoupled from the halving countdown. Analyze the impact of spot ETFs, global liquidity, and the roadmap to the 2028 halving in this 2026 market
USD Dollar Trend Forecast: Dollar Index Falls Below 97.0 to 4-Year Low, Will the Dollar Continue To Fall or Bottom Out in 2026?
TradingKey - In January 2026, the US Dollar Index continued its downward trend from 2025, officially breaking below the key 97.0 level and reaching a low of 95.5, marking a nearly four-year low since February 2022.

