

Chainlink Price Forecast: LINK targets $25 amid rising whale activity

- Chainlink records a nearly 2% increase on Thursday, fuelled by the increased capital flow and risk-on sentiment.
- Whale activity in Chainlink has increased with 25 million LINK tokens added to their holdings since February.
- The technical outlook suggests a potential bullish pattern breakout rally as sentiment improves.
Chainlink (LINK) trades higher at $16.45, up by over 2% at the time of writing on Thursday, mirroring the wider cryptocurrency market recovery, with Bitcoin hitting a new all-time high. On-chain data reveals rising support from whales, reinforcing the bullish sentiment. The technical outlook signals a potential inverted head and shoulders pattern breakout in LINK, adding further upside potential.
Chainlink targets $25 with a trend reversal pattern
Chainlink trades at $16.45 at the press time, building over the 2.48% jump on Wednesday. With the second positive candle, LINK exceeds the 200-day Exponential Moving Average (EMA) at $16.01, targeting a surge to the $18 supply zone.
The overhead zone at $18 keeps the LINK price within a high-volatility price range with a lower boundary at $10.93. However, the gradual surge in underlying bullishness leads to an inverted head-and-shoulders pattern in the daily chart, signalling a potential trend reversal.
The bullish pattern is highlighted in the technical chart below, with the ongoing price recovery aiming to form the right shoulder. A 40% bullish breakout target is calculated by extrapolating the pattern’s depth over the breakout point, targeting $25.34. Notably, this coincides with the 78.6% Fibonacci level, retraced over the 63% drop from $29.26 to $10.93 between December 15 and April 8.
The Relative Strength Index (RSI), at 58, takes off from the midline, signalling a surge in buying momentum. Moreover, the rising RSI shows room for growth as it maintains distance from the overbought zone.
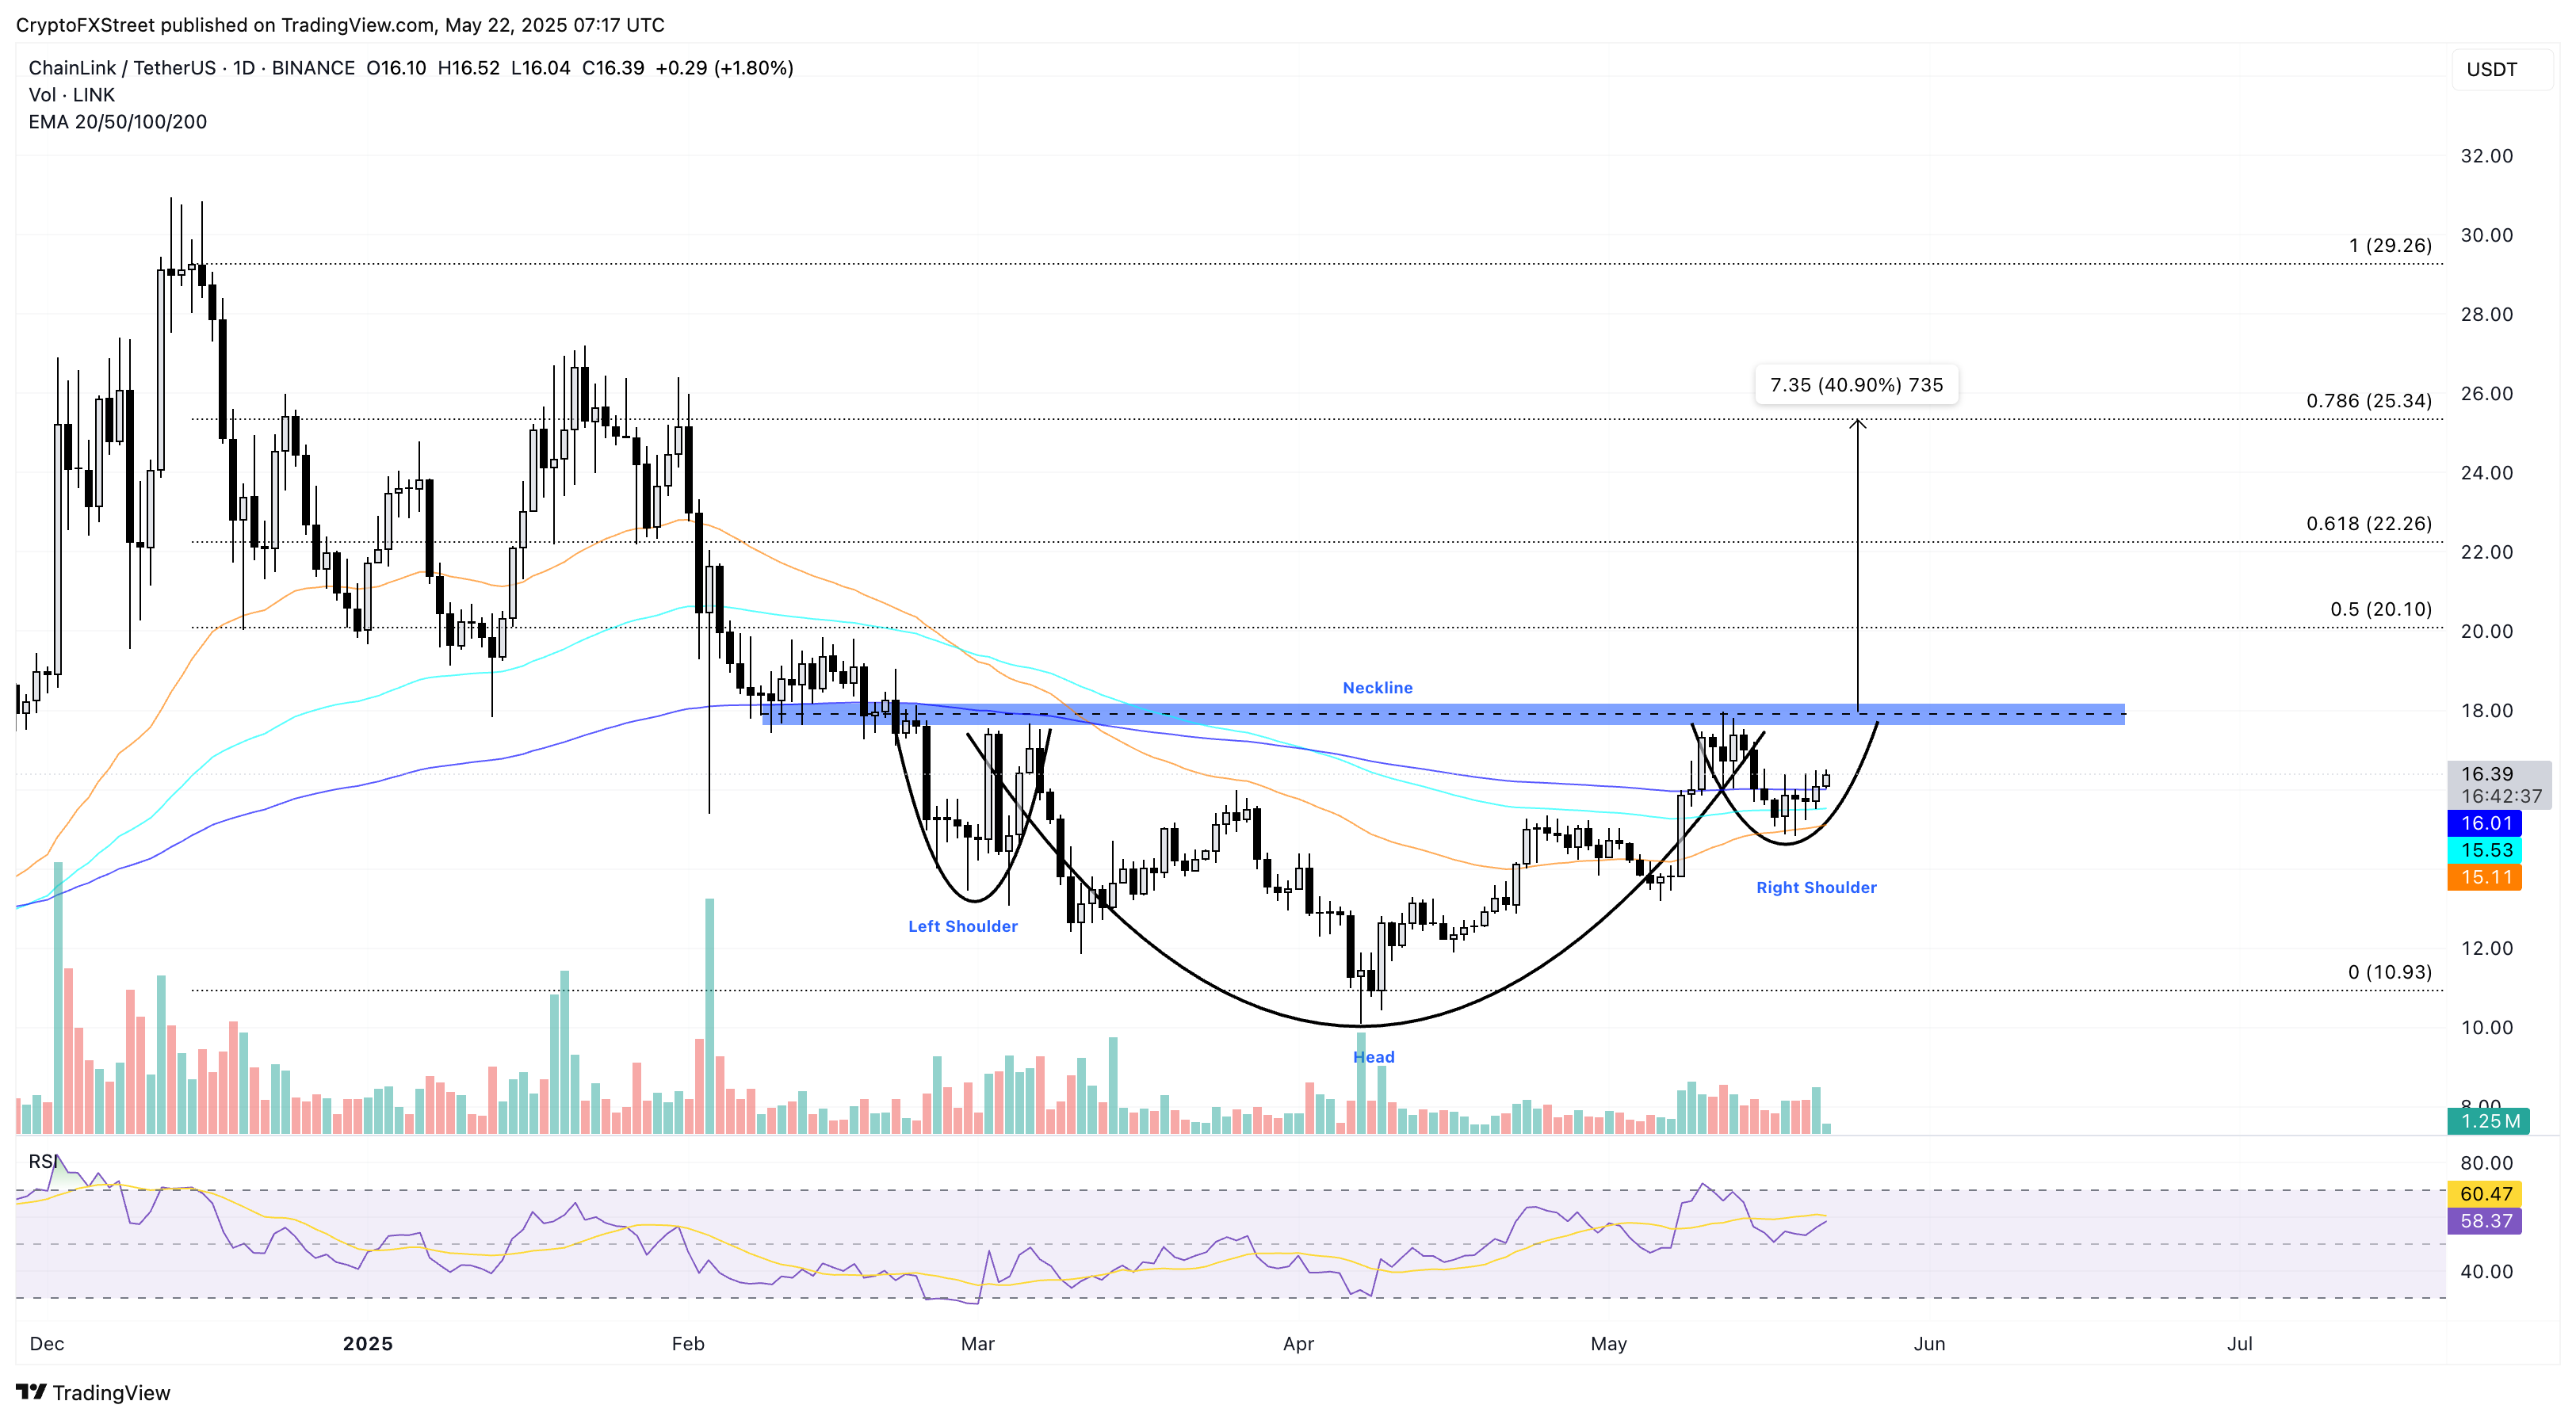
LINK/USDT price daily chart. Source: Tradingview
However, a reversal closing below the 50-day Exponential Moving Average (EMA), near the lower boundary of the right shoulder around $15.00, will invalidate the bullish pattern. This would extend the decline to $13.20, a previous higher low of the ongoing uptrend.
Whales’ activity supports LINK breakout chances
Optimistic whales have been on a buying spree as Chainlink has formed a reversal pattern since February. As per IntoTheBlock’s data, the balance by holding of investors with 100,000 to 10 million LINK tokens has witnessed a growth to 375 million from 350 million since February. The increased balance of large holders shows a growing confidence in Chainlink among smart investors.

LINK balance by holdings. Source: IntoTheBlock
Further up, the on-chain data platform highlights a spike in large transaction counts worth more than $100K. Such a large volume generally correlates with institutional or whale movement, as retail investors lack this much capital.

Number of large LINK transactions. Source: IntoTheBlock
Since May 17, the number of large transactions has increased to 228 from 97, a 135% increase. Thus, the increasing whale activity and holding support the bullish outlook on Chainlink.
Related Articles
Amazon Stock Predictions for 2026 to 2030: Will They Exceed Expectations and Achieve Major Long-Term Goals?
TradingKey - As we head into 2026, many investors are questioning where Amazon (AMZN) fits into the technology world.
A Crash After a Surge: Why Silver Lost 40% in a Week?
TradingKey - Spot silver (XAGUSD) prices continue to decline. Silver plunged 20% on Thursday, breaking below $71 per ounce, with the sell-off intensifying on Friday as prices fell further below $64. Compared to the all-time high set on January 29, silver prices have retraced more than 40%, wiping out nearly all gains accumulated over the previous month.
Is Bitcoin’s Four-Year Cycle Dead in 2026?
Is the Bitcoin 4-year cycle dead? After 2025 broke historical records with a red post-halving year, institutional analysts explore if the Bitcoin price has decoupled from the halving countdown. Analyze the impact of spot ETFs, global liquidity, and the roadmap to the 2028 halving in this 2026 market
USD Dollar Trend Forecast: Dollar Index Falls Below 97.0 to 4-Year Low, Will the Dollar Continue To Fall or Bottom Out in 2026?
TradingKey - In January 2026, the US Dollar Index continued its downward trend from 2025, officially breaking below the key 97.0 level and reaching a low of 95.5, marking a nearly four-year low since February 2022.

