

Sandbox Price Forecast: SAND bulls eyes for $1 mark

- Sandbox price extends its gains on Monday after rallying more than 16% the previous week.
- On-chain data paints a bullish picture as SAND’s open interest and whale transactions are rising.
- A weekly candlestick close below $0.46 would invalidate the bullish thesis.
Sandbox (SAND) price extends its gains by 7% and trades around $0.68 at the time of writing on Monday after rallying more than 16% the previous week. On-chain data paints a bullish picture, as SAND’s open interest and whale transactions are rising. The technical outlook suggests a rally continuation, with a target toward the $1 mark.
Sandbox price looks promising
Sandbox price found support around the previous broken descending trendline drawn by connecting multiple highs from July 2022. It bounced 18% from mid-December to the end of the month. On Monday, the gains extend by 7%, trading around $0.68 at the time of writing.
If SAND continues its upward momentum, it could extend the rally by 45% to retest the 61.8% Fibonacci retracement level, drawn from the July 2022 high of $1.49 to the August 2024 low of $0.20, at $1.00.
The Relative Strength Index (RSI) on the weekly chart reads at 59, above its neutral level of 50 and pointing upwards, indicating bullish momentum is gaining traction.
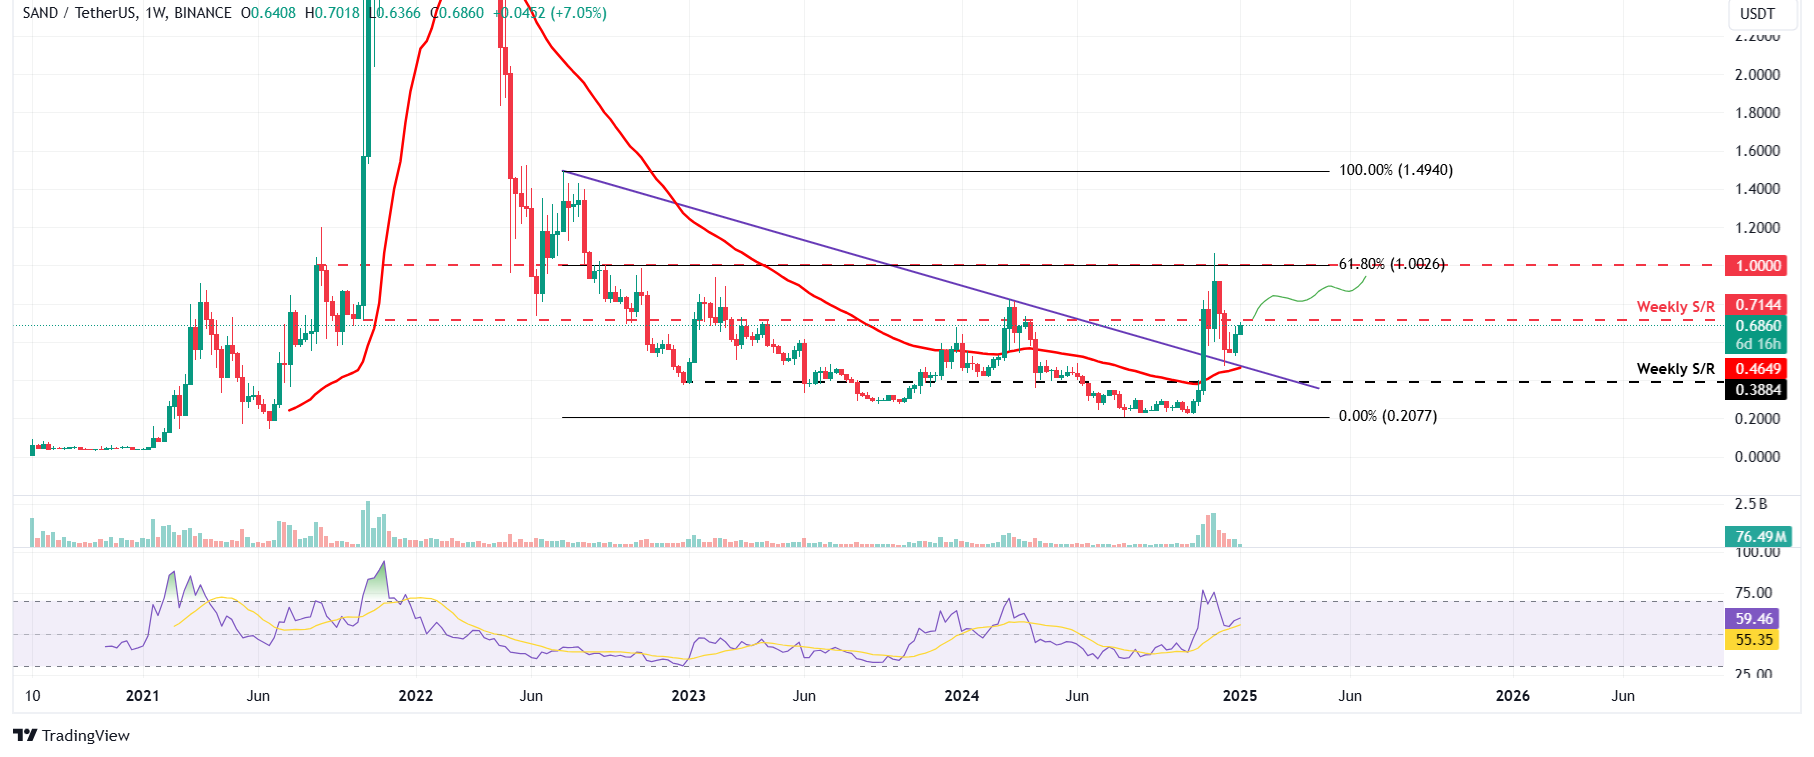
SAND/USDT weekly chart
Coinglass’s data shows that the futures’ Open Interest (OI) in SAND at exchanges rose from $82.78 million on Wednesday to $150.26 million on Monday, reaching the highest level since December 12. An increasing OI represents new or additional money entering the market and new buying, which suggests a rally ahead in the Sandbox price.
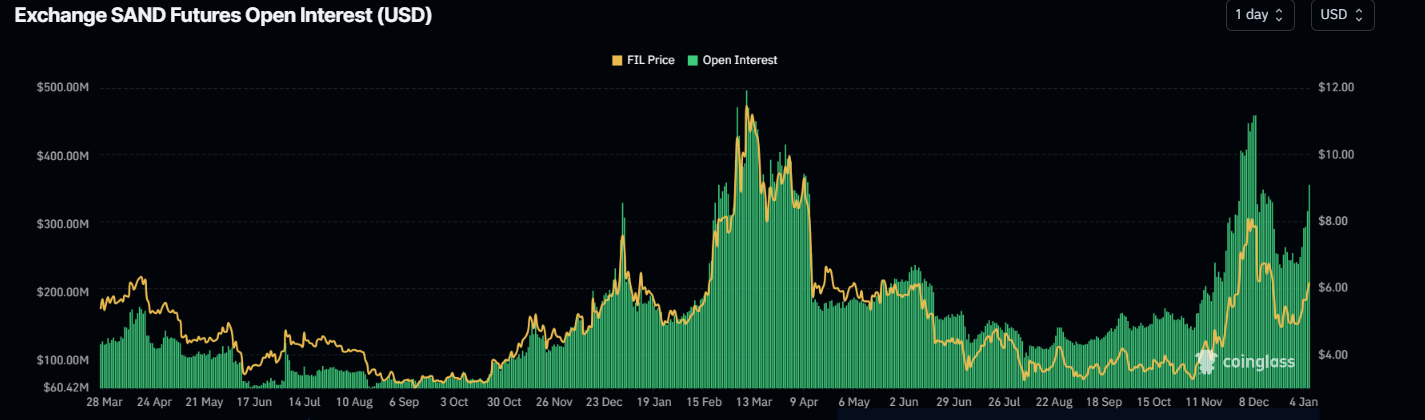
SAND Open Interest Chart. Source: Coinglass
Santiment’s Whale Transaction Count (>100K USD) shows rising spikes, indicating increasing whale activity. Moreover, the Exchange Flow Balance for SAND shows a negative value, indicating more SAND left the exchange than entered. This indicates less selling pressure from investors, adding further credence to the bullish outlook.
%20[13.13.14,%2006%20Jan,%202025]-638717501530093140.png)
SAND Whale Transaction Count (>100K USD) and Exchange Flow Balance chart. Source: Santiment
However, if the SAND weekly candlestick closes below its 50-week Exponential Moving Average (EMA) at $0.46, the bullish thesis would be invalidated, leading to a price decline toward the next weekly support level of $0.388.
Related Articles
Amazon Stock Predictions for 2026 to 2030: Will They Exceed Expectations and Achieve Major Long-Term Goals?
TradingKey - As we head into 2026, many investors are questioning where Amazon (AMZN) fits into the technology world.
A Crash After a Surge: Why Silver Lost 40% in a Week?
TradingKey - Spot silver (XAGUSD) prices continue to decline. Silver plunged 20% on Thursday, breaking below $71 per ounce, with the sell-off intensifying on Friday as prices fell further below $64. Compared to the all-time high set on January 29, silver prices have retraced more than 40%, wiping out nearly all gains accumulated over the previous month.
Is Bitcoin’s Four-Year Cycle Dead in 2026?
Is the Bitcoin 4-year cycle dead? After 2025 broke historical records with a red post-halving year, institutional analysts explore if the Bitcoin price has decoupled from the halving countdown. Analyze the impact of spot ETFs, global liquidity, and the roadmap to the 2028 halving in this 2026 market
USD Dollar Trend Forecast: Dollar Index Falls Below 97.0 to 4-Year Low, Will the Dollar Continue To Fall or Bottom Out in 2026?
TradingKey - In January 2026, the US Dollar Index continued its downward trend from 2025, officially breaking below the key 97.0 level and reaching a low of 95.5, marking a nearly four-year low since February 2022.

