

Solana Price Forecast: SOL’s technical outlook and on-chain metrics hint at a double-digit correction

- Solana price closes below the 200-day EMA support at $196 after declining more than 13% this week.
- This recent decline has led to $38 million in total liquidations, with over $33 million coming from long positions.
- Traders should remain cautious as SOL’s TVL declined more than 7% in one day.
Solana (SOL) price trades in red below $194 on Friday after declining more than 13% this week. The recent downturn has led to $38 million in total liquidations, with over $33 million coming from long positions. Traders should remain cautious as SOL’s Total Value Locked (TVL) declined more than 7% in one day, hinting at a double-digit correction ahead.
Solana price is set for a downturn as it closes below $196 support level
Solana price faced resistance around the $230 level on Tuesday. SOL declined 13% in the next two days, closing below the daily support level of $201.85 and the 100-day Exponential Moving Average (EMA) at $196 on Thursday. At the time of writing on Friday, it trades below the 100-day EMA around $194.
If the $201.85 level holds as resistance, SOl will extend the decline by 10% to retest its next support at $174.85, 200-day EMA.
The Relative Strength Index (RSI) indicator on the daily chart reads 35, below its neutral level of 50 and points downwards, indicating a strong bearish momentum.
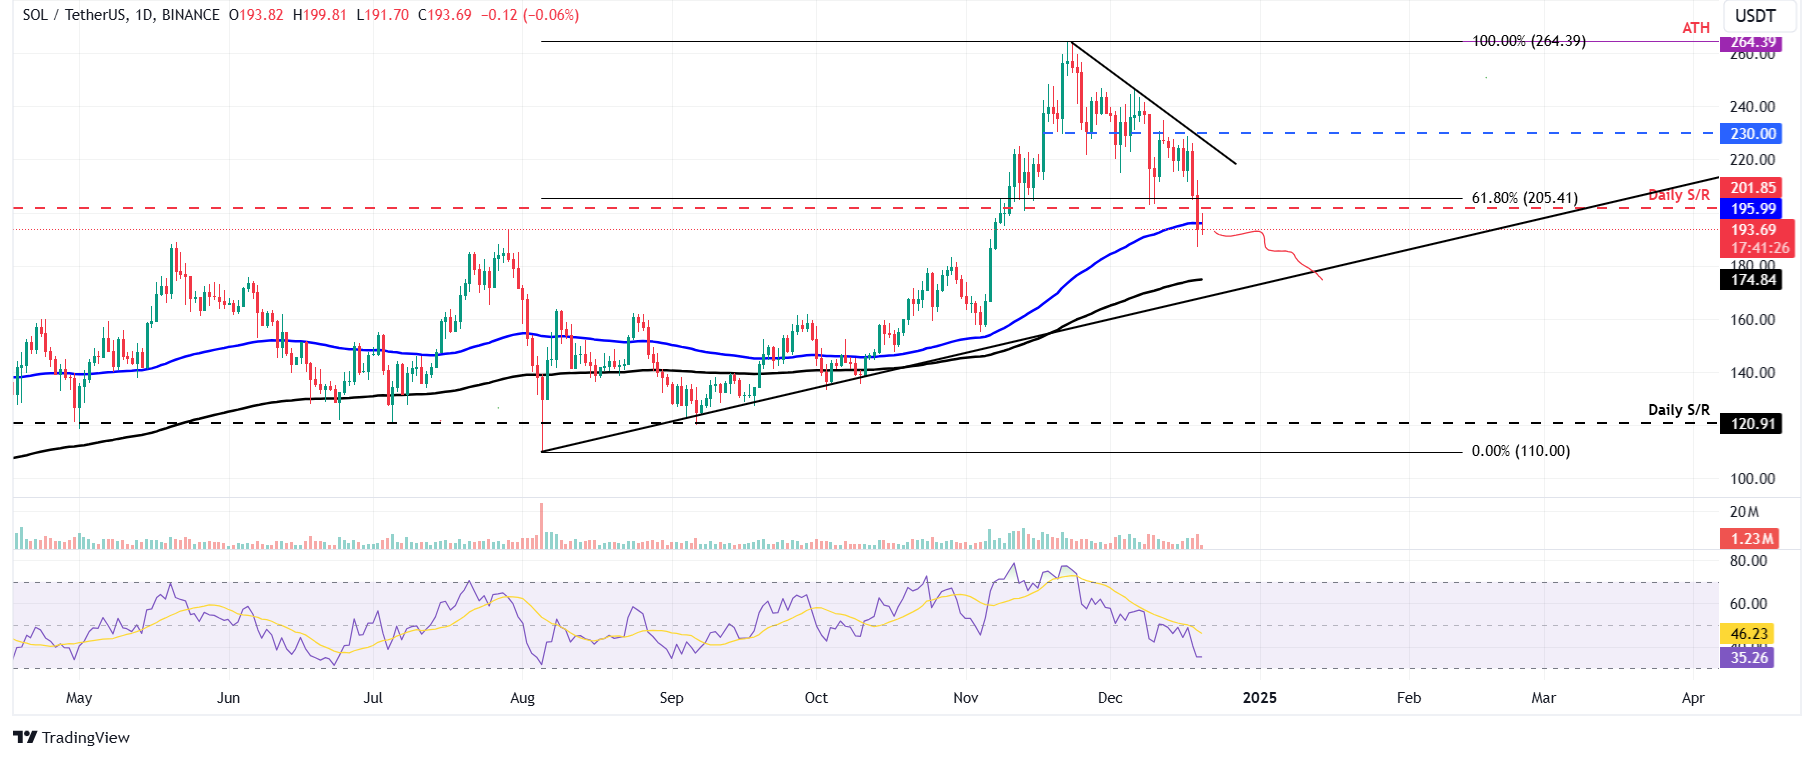
SOL/USDT daily chart
The recent price drop on Thursday triggered a wave of liquidation, removing leverage traders’ position across the SOL ecosystem. This downturn has resulted in over $38.86 million in total liquidations, with $33.57 million coming from long positions, according to data from CoinGlass.
Liquidations like this could spark Fear, Uncertainty, and Doubt (FUD) among SOL investors, raising selling pressure and leading to a further decline in its price.
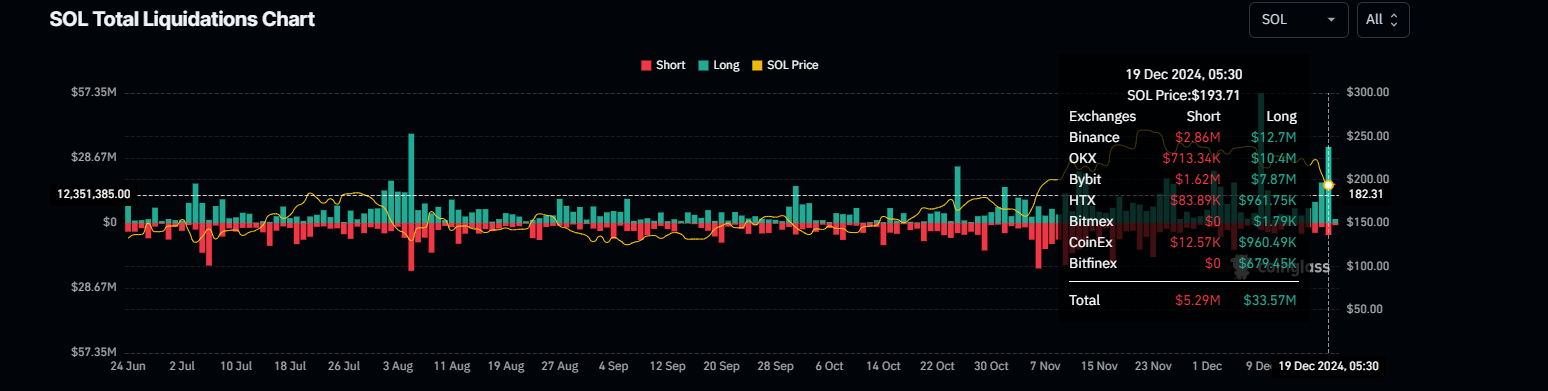
SOL Total Liquidations Chart. Source: Coinglass
Another factor adding a bearish outlook for Solance is a sharp decline in its Total Value Locked (TVL). According to data from DefiLlama, SOL TVL declined from 11.22 billion to $10.35 billion, falling more than 7% in one day. A similar fall in TVL was observed on August 3 and October 29, after which the prices had declined more than 10% in a few days. If history repeats, SOL could face a similar price decline.
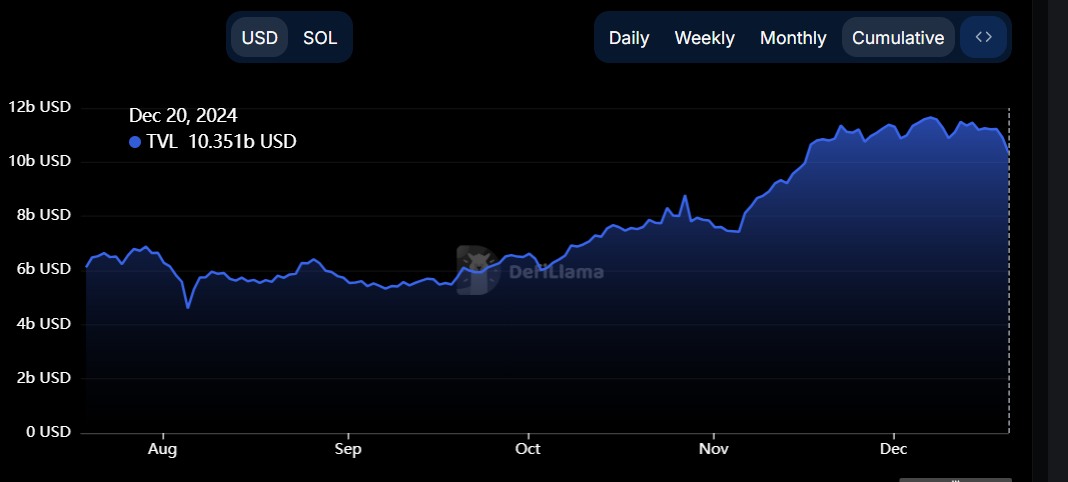
SOL TVL chart. Source: DefiLlama
Even though on-chain metrics and technical analysis support the bearish outlook, the thesis would be invalidated if the SOl price recovers and closes above the $201.8 resistance level. This recovery would lead to a price rally to retest its next resistance level at $230.
Related news
- Top 3 Price Prediction Bitcoin, Ethereum, Ripple: BTC, ETH and XRP crash, wiping $1.17 billion from the market
- Cardano Price Prediction: Bearish signal emerges as ADA eyes rebound to $1.20
- Aave Price Forecast: Poised for double-digit correction as holders book profit
Recommended Articles


Comments (0)
Click the $ button, enter the symbol, and select to link a stock, ETF, or other ticker.