US natgas futures slide 2% on warm weather and forecasts for lower demand this week

By Scott DiSavino
NEW YORK, March 9 (Reuters) - U.S. natural gas futures slid about 2% on Monday on forecasts for less demand this week than previously expected.
Front-month gas futures for April delivery NGc1 on the New York Mercantile Exchange fell 6.6 cents, or 2.1%, to settle at $3.12 per million British thermal units (mmBtu).
Limiting losses were forecasts for cooler weather and more demand next week and soaring global energy prices and supply concerns as the U.S.-Iran war escalated.
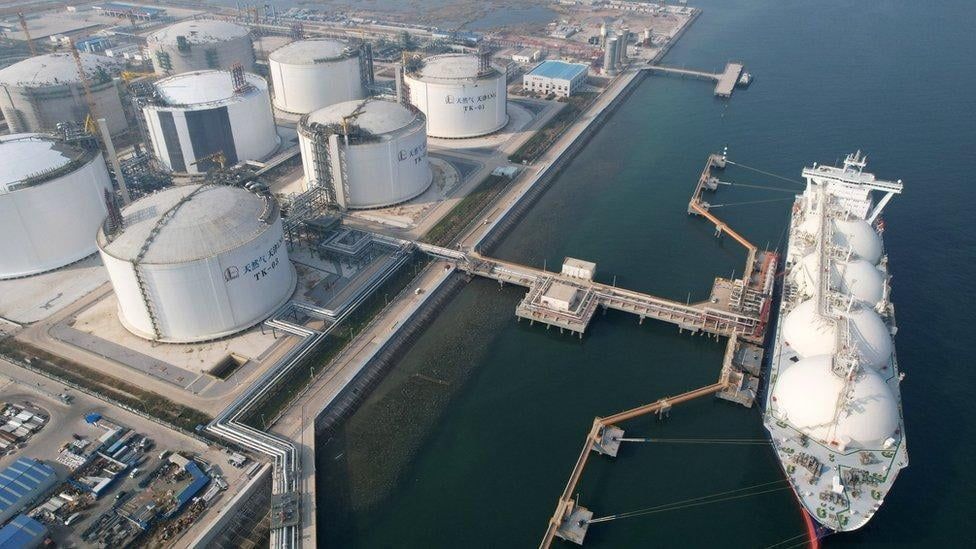
The shutdown of liquefied natural gas (LNG) export production in Qatar removed about 20% of global LNG supplies. Prices in the U.S. have reacted, but not by as much as elsewhere in the world because America produces all the gas it needs and was already exporting all the LNG it could.
So, no matter how high global gas prices go, the U.S. cannot export much more gas.
Since the U.S. and Israel bombed Iran on February 28, U.S. gas prices have risen about 9% versus 75% in Europe TRNLTTFMc1 and 51% in Asia JKMc1.
SUPPLY AND DEMAND
Average gas output in the U.S. Lower 48 states rose to 110.0 billion cubic feet per day (bcfd) so far in March, up from 109.2 bcfd in February, according to data from financial firm LSEG. That compares with a monthly record high of 110.6 bcfd in December 2025.
Energy analysts said mostly mild weather in recent weeks has allowed energy firms to leave more gas in storage than usual for this time of year, which should keep stockpiles about 2% below normal for the week ended March 6, the same as during the week ended February 27. EIA/GAS NGAS/POLL
Meteorologists forecast weather across the country will remain mostly warmer than normal through March 24, which should keep heating demand and the amount of gas energy firms need to pull from storage low in coming weeks. The weather, however, is expected to be colder next week than this week.
LSEG projected average gas demand in the Lower 48 states, including exports, would jump from 110.9 bcfd this week to 126.1 bcfd next week. The forecast for this week was lower than LSEG's outlook on Friday, while its forecast for next week was higher.
Average gas flows to the nine big U.S. LNG export plants slid to 18.1 bcfd so far in March, down from a record 18.7 bcfd in February.
In Texas, Freeport LNG's 2.4-bcfd export plant was on its way back to full production after shutting on Sunday due to a feedgas issue.
In the Middle East, QatarEnergy halted LNG production and declared a force majeure due to the Iran war, causing global gas prices to soar. Qatar is one of the biggest LNG producers in the world along with the U.S. and Australia.
Gas soared to a three-year high of around $21 per mmBtu at the Dutch Title Transfer Facility (TTF) TRNLTTFMc1 benchmark in Europe and close to a two-year high of around $16 at the Japan-Korea Marker (JKM) JKMc1 benchmark in Asia. NG/EU
| Week ended Mar 6 Forecast | Week ended Feb 27 Actual | Year ago Mar 6 | Five-year average (2021-2025) Mar 6 |
|
U.S. weekly natgas storage change (bcf): | -53 | -132 | -64 | -64 |
|
U.S. total natgas in storage (bcf): | 1,833 | 1,886 | 1,707 | 1,865 |
|
U.S. total storage versus 5-year average | -1.7% | -2.2% |
|
|
|
|
|
|
|
|
|
|
|
|
|
|
|
Global Gas Benchmark Futures ($ per mmBtu) | Current Day | Prior Day | This Month Last Year | Prior Year Average 2025 | Five-Year Average (2021-2025) |
Henry Hub NGc1 | 3.37 | 3.19 | 4.14 | 3.62 | 3.79 |
Title Transfer Facility (TTF) TRNLTTFMc1 | 21.29 | 18.07 | 13.21 | 11.94 | 18.51 |
Japan-Korea Marker (JKM) JKMc1 | 15.71 | 15.50 | 13.50 | 12.24 | 18.12 |
|
|
|
|
|
|
|
|
|
|
|
|
LSEG U.S. Global Forecast System (GFS) Heating, Cooling and Total Degree Days |
|
|
|
|
|
Two-Week Total Forecast | Current Day | Prior Day | Prior Year | 10-Year Norm | 30-Year Norm |
U.S. GFS Heating Degree Days (HDD) | 258 | 231 | 229 | 283 | 291 |
U.S. GFS Cooling Degree Days (CDD) | 30 | 26 | 11 | 15 | 10 |
U.S. GFS Total Degree Days (TDD) | 288 | 257 | 240 | 298 | 301 |
|
|
|
|
|
|
LSEG U.S. Weekly GFS Supply and Demand Forecasts |
|
|
|
|
|
| Prior Week | Current Week | Next Week | This Week Last Year | Five-Year (2021-2025) Average for Month |
U.S. Supply (bcfd) |
|
|
|
|
|
U.S. Lower 48 Dry Production | 109.8 | 110.3 | 110.2 | 106.1 | 99.9 |
U.S. Imports from Canada | 8.3 | 7.7 | 8.7 | N/A | 8.0 |
U.S. LNG Imports | 0.1 | 0.0 | 0.0 | 0.1 | 0.1 |
Total U.S. Supply | 118.1 | 118.0 | 118.9 | N/A | 108.0 |
|
|
|
|
|
|
U.S. Demand (bcfd) |
|
|
|
|
|
U.S. Exports to Canada | 3.7 | 4.2 | 4.0 | N/A | 3.4 |
U.S. Exports to Mexico | 6.8 | 6.3 | 6.6 | N/A | 5.8 |
U.S. LNG Export Feedgas | 18.2 | 18.6 | 18.5 | 15.5 | 13.2 |
U.S. Commercial | 12.5 | 9.6 | 13.6 | 10.9 | 12.1 |
U.S. Residential | 18.9 | 13.4 | 20.5 | 16.6 | 18.3 |
U.S. Power Plant | 31.8 | 27.9 | 29.9 | 30.4 | 31.8 |
U.S. Industrial | 24.1 | 23.2 | 24.9 | 23.7 | 24.5 |
U.S. Plant Fuel | 5.4 | 5.5 | 5.4 | 5.4 | 5.4 |
U.S. Pipe Distribution | 2.5 | 2.2 | 2.6 | 2.5 | 4.0 |
U.S. Vehicle Fuel | 0.1 | 0.1 | 0.1 | 0.1 | 0.2 |
Total U.S. Consumption | 95.4 | 81.8 | 97.0 | 89.6 | 96.3 |
Total U.S. Demand | 124.1 | 110.9 | 126.1 | N/A | 118.7 |
|
|
|
|
|
|
N/A = Not Available |
|
|
|
|
|
|
|
|
|
|
|
U.S. Northwest River Forecast Center (NWRFC) at The Dalles Dam (fiscal year ending September 30) | 2026 Current Day % of Normal Forecast | 2026 Prior Day % of Normal Forecast | 2025 % of Normal Actual | 2024 % of Normal Actual | 2023 % of Normal Actual |
Apr-Sep | 98 | 96 | 76 | 74 | 83 |
Jan-Jul | 98 | 95 | 78 | 76 | 77 |
Oct-Sep | 102 | 99 | 80 | 77 | 76 |
|
|
|
|
|
|
U.S. weekly power generation percent by fuel - EIA |
|
|
|
|
|
| Week ended Mar 13 | Week ended Mar 6 | 2025 | 2024 | 2023 |
Wind | 18 | 13 | 11 | 11 | 10 |
Solar | 6 | 7 | 6 | 5 | 4 |
Hydro | 6 | 7 | 6 | 6 | 6 |
Other | 1 | 1 | 1 | 1 | 2 |
Petroleum | 0 | 0 | 0 | 0 | 0 |
Natural Gas | 38 | 38 | 40 | 42 | 41 |
Coal | 15 | 15 | 18 | 16 | 17 |
Nuclear | 19 | 19 | 18 | 19 | 19 |
|
|
|
|
|
|
SNL U.S. Natural Gas Next-Day Prices ($ per mmBtu) |
|
|
|
|
|
Hub | Current Day | Prior Day | This Month Last Year | Prior Year Average 2025 | Five-Year Average (2021-2025) |
Henry Hub NG-W-HH-SNL | 3.10 | 2.90 | 4.13 | 3.52 | 3.72 |
Transco Z6 New York NG-CG-NY-SNL | 2.35 | 2.35 | 3.40 | 3.53 | 3.56 |
PG&E Citygate NG-CG-PGE-SNL | 1.59 | 1.58 | 3.52 | 3.42 | 5.47 |
Eastern Gas (old Dominion South) NG-PCN-APP-SNL | 2.15 | 2.24 | 3.29 | 2.79 | 2.96 |
Chicago Citygate NG-CG-CH-SNL | 2.59 | 2.52 | 3.53 | 3.23 | 3.60 |
Algonquin Citygate NG-CG-BS-SNL | 2.99 | 4.75 | 3.74 | 6.08 | 5.04 |
SoCal Citygate NG-SCL-CGT-SNL | 2.00 | 2.07 | 3.53 | 3.60 | 5.71 |
Waha Hub NG-WAH-WTX-SNL | -2.23 | -1.82 | 0.78 | 1.15 | 2.88 |
AECO NG-ASH-ALB-SNL | 1.26 | 1.24 | 1.47 | 1.13 | 2.13 |
|
|
|
|
|
|
ICE U.S. Power Next-Day Prices ($ per megawatt-hour) |
|
|
|
|
|
Hub | Current Day | Prior Day | This Month Last Year | Prior Year Average 2025 | Five-Year Average (2021-2025) |
New England E-NEPLMHP-IDX | 69.00 | 69.00 | 50.19 | 77.61 | 61.79 |
PJM West E-PJWHRTP-IX | 44.24 | 45.23 | 48.35 | 60.23 | 54.47 |
Mid C W-MIDCP-IDX | 6.23 | 4.28 | 34.51 | 44.81 | 68.96 |
Palo Verde W-PVP-IDX | 7.73 | 3.45 | 23.31 | 34.82 | 59.94 |
SP-15 W-SP15-IDX | 7.17 | 2.09 | 16.63 | 28.44 | 53.02 |