POLL-US 2026-27 corn plantings seen at 94.9 million acres, soybeans 84.9 million

WASHINGTON, Feb 17 (Reuters) - The following are analysts' forecasts of U.S. plantings, yield, production and ending stocks of corn, soybeans and wheat for the 2026-27 marketing year, ahead of the U.S. Department of Agriculture's annual outlook forum on February 19-20.
The USDA will publish its estimates at 7 a.m. EST (1200 GMT) on Thursday, February 19.
Planted area is shown in millions of acres. Grain and soy yields are shown in bushels per acre, while production and ending stocks figures are shown in billions of bushels.
CORN
Planted acres | Yield | Production | 2026-27 end-stocks | |
Average trade estimate | 94.9 | 183.5 | 15.940 | 1.978 |
Highest trade estimate | 96.8 | 186.0 | 16.750 | 2.170 |
Lowest trade estimate | 94.0 | 181.5 | 15.600 | 1.736 |
USDA 2026 Long-term forecast | 95.0 | 182.0 | 15.815 | 2.019 |
USDA final 2025-26 figures | 98.8 | 186.5 | 17.021 | 2.127 |
USDA 2025 outlook forum for 2025-26 | 94.0 | 181.0 | 15.585 | 1.965 |
Number of forecasts | 14 | 12 | 13 | 13 |
ADM Investor Services | 95.0 | 182.0 | 15.815 | 1.993 |
Allendale Inc | 94.8 | 183.0 | 15.840 | 1.947 |
Brock Associates | 95.0 | 185.0 | 15.859 | 1.736 |
Brugler Marketing & Management | 94.5 | 182.0 | 15.625 | 1.900 |
CoBank | 94.0 | na | na | na |
CHS Market Advisors | 95.0 | 186.0 | 16.219 | 2.063 |
Doane Advisory Services | 95.0 | 183.0 | 15.921 | 1.876 |
Futures International | 96.8 | 184.5 | 16.750 | 2.100 |
Grain Cycles | 94.5 | 182.0 | 15.834 | 2.011 |
Marex Capital | 94.0 | na | 15.600 | 2.000 |
Midland Research | 95.0 | 184.5 | 16.025 | 2.107 |
Northstar Commodity | 95.2 | 183.0 | 15.940 | 1.800 |
Sid Love Consulting | 95.0 | 185.0 | 15.993 | 2.170 |
Zaner Ag Hedge | 95.0 | 181.5 | 15.795 | 2.010 |
SOYBEANS
Planted acres | Yield | Production | 2026-27 end-stocks | |
Average trade estimate | 84.9 | 52.8 | 4.412 | 0.349 |
Highest trade estimate | 86.0 | 53.5 | 4.490 | 0.440 |
Lowest trade estimate | 83.5 | 52.0 | 4.320 | 0.250 |
USDA 2026 Long-term forecast | 85.0 | 53.0 | 4.465 | 0.314 |
USDA final 2025-26 figures | 81.2 | 53.0 | 4.262 | 0.350 |
USDA 2025 outlook forum for 2025-26 | 84.0 | 52.5 | 4.370 | 0.320 |
Number of forecasts | 14 | 12 | 13 | 13 |
| ||||
ADM Investor Services | 85.0 | 53.0 | 4.465 | 0.374 |
Allendale Inc | 85.0 | 53.5 | 4.490 | 0.301 |
Brock Associates | 85.2 | 53.0 | 4.473 | 0.350 |
Brugler Marketing & Management | 85.5 | 52.5 | 4.430 | 0.315 |
CoBank | 86.0 | na | na | na |
CHS Market Advisors | 84.5 | 53.0 | 4.434 | 0.384 |
Doane Advisory Services | 84.0 | 52.5 | 4.370 | 0.250 |
Futures International | 84.0 | 53.3 | 4.320 | 0.345 |
Grain Cycles | 85.5 | 53.0 | 4.484 | 0.396 |
Marex Capital | 86.0 | na | 4.335 | 0.400 |
Midland Research | 84.6 | 52.3 | 4.370 | 0.265 |
Northstar Commodity | 85.0 | 52.0 | 4.375 | 0.440 |
Sid Love Consulting | 85.0 | 53.0 | 4.465 | 0.375 |
Zaner Ag Hedge | 83.5 | 52.5 | 4.340 | 0.340 |
WHEAT
Planted acres | Yield | Production | 2026-27 end-stocks | |
Average trade estimate | 44.8 | 51.9 | 1.895 | 0.901 |
Highest trade estimate | 46.5 | 53.0 | 2.000 | 0.990 |
Lowest trade estimate | 44.0 | 50.8 | 1.819 | 0.860 |
USDA 2026 Long-term forecast | 44.0 | 50.8 | 1.819 | 0.832 |
USDA final 2025-26 figures | 45.3 | 53.3 | 1.985 | 0.931 |
USDA 2025 outlook forum for 2025-26 | 47.0 | 50.1 | 1.926 | 0.826 |
Number of forecasts | 13 | 12 | 13 | 13 |
ADM Investor Services | 44.0 | 52.5 | 1.880 | 0.910 |
Allendale Inc | 44.3 | 50.8 | 1.833 | 0.915 |
Brock Associates | 44.5 | 50.8 | 1.839 | 0.865 |
Brugler Marketing & Management | 44.5 | 53.0 | 1.906 | 0.875 |
CHS Market Advisors | 44.9 | 53.0 | 1.963 | 0.903 |
Doane Advisory Services | 45.3 | 53.0 | 1.965 | 0.940 |
Futures International | 46.5 | 52.3 | 1.940 | 0.900 |
Grain Cycles | 44.0 | 50.8 | 1.819 | 0.862 |
Marex Capital | 46.0 | na | 2.000 | 0.975 |
Midland Research | 44.3 | 51.7 | 1.835 | 0.860 |
Northstar Commodity | 44.5 | 53.0 | 1.900 | 0.990 |
Sid Love Consulting | 44.0 | 50.8 | 1.819 | 0.862 |
Zaner Ag Hedge | 45.6 | 51.5 | 1.930 | 0.860 |
Related Articles
When Investing in Virtual Land or the Metaverse, Why Meta Is the Best Choice?
TradingKey - Interest in digital real estate peaked in the early 2020s, but now that interest in it has cooled, and prices have dropped, the practical questions start for investors. If investors want exposure to virtual land or the Metaverse, how should investors approach it? For virtual land invest
Nuclear Energy Is Paving the Way for the Future of AI: Should You Invest in Nuclear Energy Stocks in 2026?
With AI demand stretching the grid in 2026, nuclear remains the only baseload source that is not carbon-intensive. We discuss whether it is too late to buy and which stocks have the best risk-reward.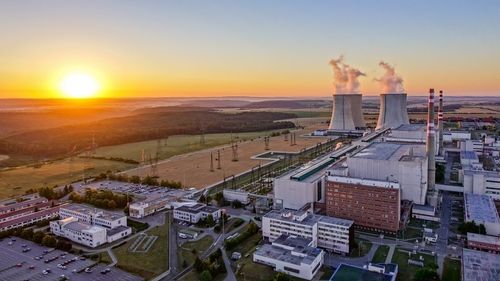
This $1 Trillion AI Stock Is Getting Ready for 2026: Is Meta a Good Buy?
When ads and commerce are factored in, Meta is building a long-term platform—in Augmented Reality and smart glasses — to get us closer to the future of AI. This device hardware business is less profitable than ads right now, but it could grow the company’s ecosystem and open up new ways for it to ma
Best AI Tools for Stock Analysis in 2026 to Boost Your Investment Portfolio
As Artificial Intelligence (AI) continues to enhance everyday decision-making, these tools will allow us to leverage artificial intelligence to analyse stocks and optimise our investment portfolio.
An Overview of U.S. Government Shutdowns: Causes and Consequences
TradingKey - A government shutdown is a uniquely American political event. After former President Donald Trump orchestrated the longest and most costly government shutdown in history during his first term, the risk of another shutdown has resurfaced at the start of his second term.