

Gold price bulls seem reluctant amid modest USD strength; downside seems cushioned

- Gold price remains below a one-week high amid mixed fundamental cues.
- A modest USD strength and a positive risk tone cap the safe-haven commodity.
- Rising September Fed rate cut bets should act as a tailwind for the XAU/USD pair.
Gold price (XAU/USD) struggles to capitalize on a modest Asian session uptick and currently trades just below a nearly two-week high touched the previous day. Friday's weaker-than-expected US Nonfarm Payrolls (NFP) pointed to a cooling labor market and fueled speculations that the Federal Reserve (Fed) will resume its rate-cutting cycle in September. This keeps the US Treasury bond yields depressed and turns out to be a key factor lending support to the non-yielding yellow metal.
Meanwhile, US President Donald Trump signed an executive order last week imposing tariffs on several trading partners that go into effect on August 7. Adding to this, the uncertainty over the fate of China's trade relations with the US further benefits the safe-haven Gold price. However, the emergence of some US Dollar (USD) buying acts as a headwind for the precious metal. Moreover, the upbeat market mood contributes to keeping a lid on the commodity and warrants caution for bulls.
Daily Digest Market Movers: Gold price bulls have the upper hand as September Fed rate cut bets could cap the USD
- Traders ramped up their bets for rate cuts by the Federal Reserve following the release of the latest US jobs data, which pointed to a sharp deterioration in labor market conditions. According to the CME Group's FedWatch Tool, traders now see over a 90% chance that the Fed will lower borrowing costs in September.
- The US Commerce Department's Census Bureau reported on Monday that Factory Orders plunged 4.8% in June following an upwardly revised 8.3% rise in the previous month. This adds to concerns about the state of the US economy amid US President Donald Trump's erratic trade policies and supports the Gold price.
- Trump signed an executive order last Thursday raising tariffs on dozens of countries, ranging from 10% to 41%, that go into effect on August 7. The Trump administration said that the universal tariff will remain at 10% for countries with which the US has a trade surplus, while nations with which the US has a trade deficit face a 15% floor.
- China and the US – the world's two largest economic giants – are yet to agree on a trade deal. US Treasury Secretary Scott Bessent has said that any extension of the 90-day tariff truce, which is set to expire later this month, would be up to Trump. This keeps investors on edge and could benefit the safe-haven commodity.
- The US Dollar attracts some buyers and, for now, seems to have stalled the post-NFP downfall from an over one-month peak. This is holding back the XAU/USD bulls from placing fresh bets and caps the upside. Traders now look to the US ISM Services PMI for some impetus later during the North American session.
Gold price is more likely to attract dip-buyers and find decent support near the 200-SMA on H4, around the $3,350 area
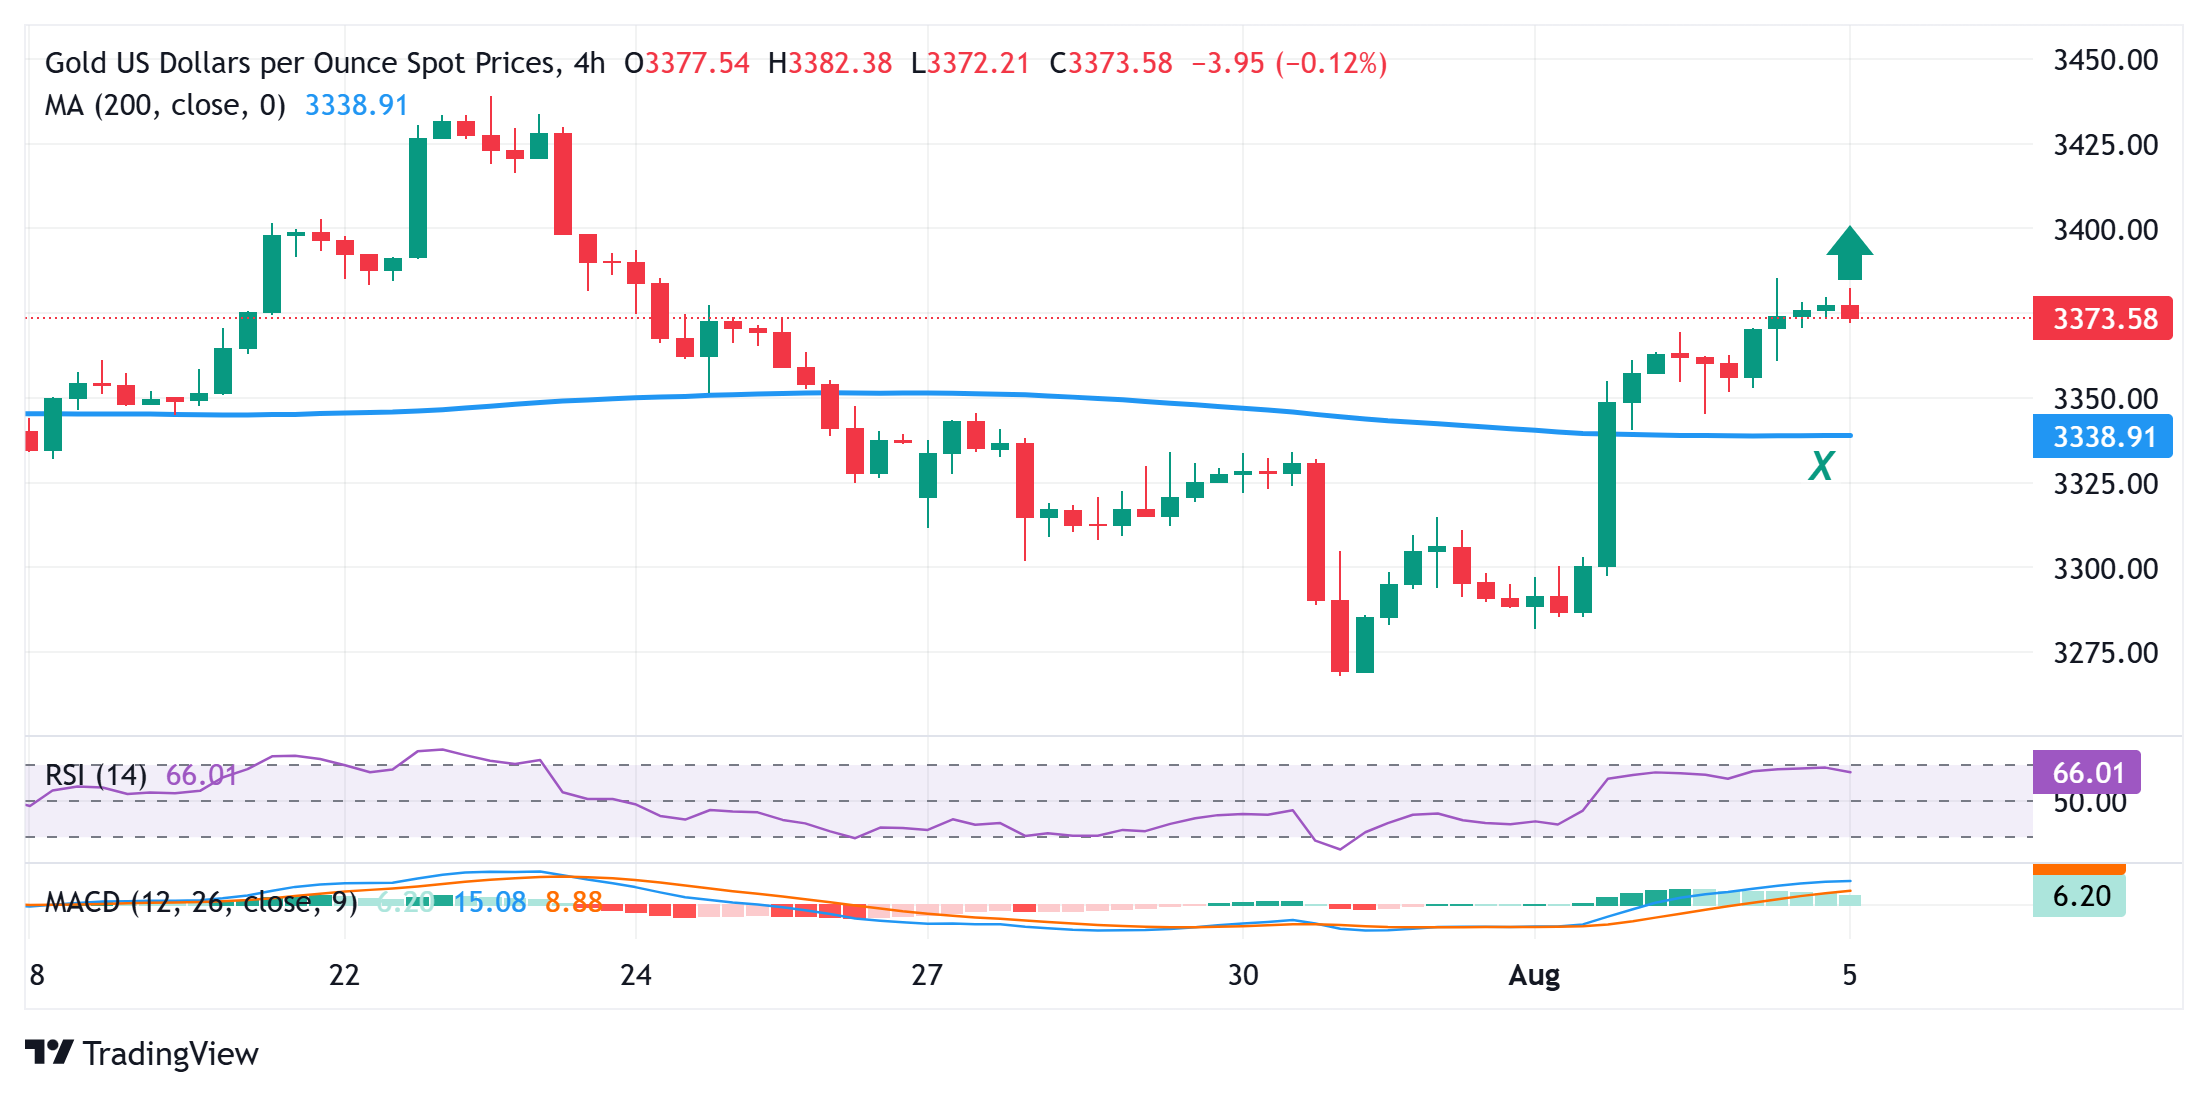
From a technical perspective, Friday's breakout through the $3,335 horizontal barrier and a subsequent strength beyond the 100-period Simple Moving Average (SMA) on the 4-hour chart favors the XAU/USD bulls. Moreover, oscillators on daily/4-hour charts have been gaining positive traction and back the case for an extension of a multi-day-old uptrend. Hence, any further slide below the $3,366-3,365 immediate support could be seen as a buying opportunity and remain limited near the $3,350-3,349 region. The latter represents the 200-period SMA on the 4-hour chart and should act as a key pivotal point, which, if broken, could make the Gold price vulnerable to accelerate the fall towards the $3,325-3,322 intermediate support en route to the $3,300 mark.
On the flip side, the overnight swing high, around the $3,385 region, now seems to act as an immediate hurdle ahead of the $3,400 round figure. Some follow-through buying should allow the Gold price to climb further towards the next relevant hurdle around the $3,434-3,435 area. The positive momentum could extend further and eventually lift the XAU/USD towards the all-time peak, around the $3,500 psychological mark touched in April.
US Dollar PRICE Today
The table below shows the percentage change of US Dollar (USD) against listed major currencies today. US Dollar was the strongest against the New Zealand Dollar.
| USD | EUR | GBP | JPY | CAD | AUD | NZD | CHF | |
|---|---|---|---|---|---|---|---|---|
| USD | 0.14% | 0.05% | 0.06% | 0.10% | 0.26% | 0.34% | 0.27% | |
| EUR | -0.14% | -0.09% | -0.07% | -0.03% | 0.04% | 0.13% | 0.13% | |
| GBP | -0.05% | 0.09% | -0.02% | 0.05% | 0.13% | 0.22% | 0.10% | |
| JPY | -0.06% | 0.07% | 0.02% | 0.04% | 0.28% | 0.26% | 0.20% | |
| CAD | -0.10% | 0.03% | -0.05% | -0.04% | 0.11% | 0.16% | 0.04% | |
| AUD | -0.26% | -0.04% | -0.13% | -0.28% | -0.11% | 0.13% | -0.03% | |
| NZD | -0.34% | -0.13% | -0.22% | -0.26% | -0.16% | -0.13% | -0.05% | |
| CHF | -0.27% | -0.13% | -0.10% | -0.20% | -0.04% | 0.03% | 0.05% |
The heat map shows percentage changes of major currencies against each other. The base currency is picked from the left column, while the quote currency is picked from the top row. For example, if you pick the US Dollar from the left column and move along the horizontal line to the Japanese Yen, the percentage change displayed in the box will represent USD (base)/JPY (quote).
Recommended Articles


Comments (0)
Click the $ button, enter the symbol, and select to link a stock, ETF, or other ticker.