

Gold price slides further below $3,300, over one-week low amid a firmer USD

- Gold price remains under some selling pressure amid reduced bets for a Fed rate cut in July.
- The USD stands firm near a two-week high and contributes to the commodity’s offered tone.
- Tariff jitter weigh on investors’ sentiment, though it does little to impress the XAU/USD bulls.
Gold price (XAU/USD) trades with a negative bias below the $3,300 mark during the Asian session on Wednesday and drops to a one-and-a-half-week low in the last week. The growing acceptance that the Federal Reserve (Fed) will keep interest rates steady for an extended period amid expectations that steep US tariffs would underpin inflation in the coming months had been a key factor behind the recent rise in the US Treasury bond yields. This keeps the US Dollar (USD) pinned near a two-week high set on Tuesday and turns out to be a key factor weighing on the non-yielding yellow metal.
Meanwhile, the global risk sentiment remains fragile on the back of concerns about the potential economic fallout from Trump’s trade tariffs. This is evident from a generally weaker tone around the equity markets and could offer some support to the safe-haven Gold price. Traders might also opt to wait for more cues about the Fed's rate-cut path before placing aggressive directional bets. Hence, the focus remains glued to the release of FOMC meeting minutes, due later during the US session, which will influence the USD price dynamics and provide a fresh impetus to the XAU/USD pair.
Daily Digest Market Movers: Gold price is weighed down by reduced Fed rate cut bets
- US President Donald Trump unnerved investors earlier this week by announcing higher tariff rates against a slew of major economies starting August 1. Moreover, Trump vowed to further escalate his trade wars on Tuesday, threatening US tariffs of up to 200% on foreign drugs and 50% on copper.
- Investors now seem convinced that US tariffs will eventually feed through into higher prices and allow the Federal Reserve to stick to its wait-and-see approach. Moreover, the upbeat US jobs report for June eased concerns about a slowing US economy, and a July Fed rate cut is completely off the table.
- This, in turn, pushed the yield on the benchmark 10-year US government bond and the US Dollar to a two-week high, making the non-yielding Gold price less attractive. The USD bulls, however, seem reluctant and opt to wait for more cues about the Fed's rate cut path before placing fresh bets.
- Meanwhile, investors are still pricing in the possibility of 50 basis points worth of Fed rate cuts by the end of this year, starting in October. Hence, the minutes of the last FOMC meeting and speeches by several Fed officials this week will be looked for more insights into the central bank's policy outlook.
- In the meantime, Trump's rapidly shifting stance on trade policies and worries that steep US tariffs would negatively impact the global economy keep investors on edge. This might hold back traders from placing aggressive bearish bets around the safe-haven XAU/USD pair and limit deeper losses.
Gold price seems vulnerable to depreciate further; breakdown below $3,300 in play
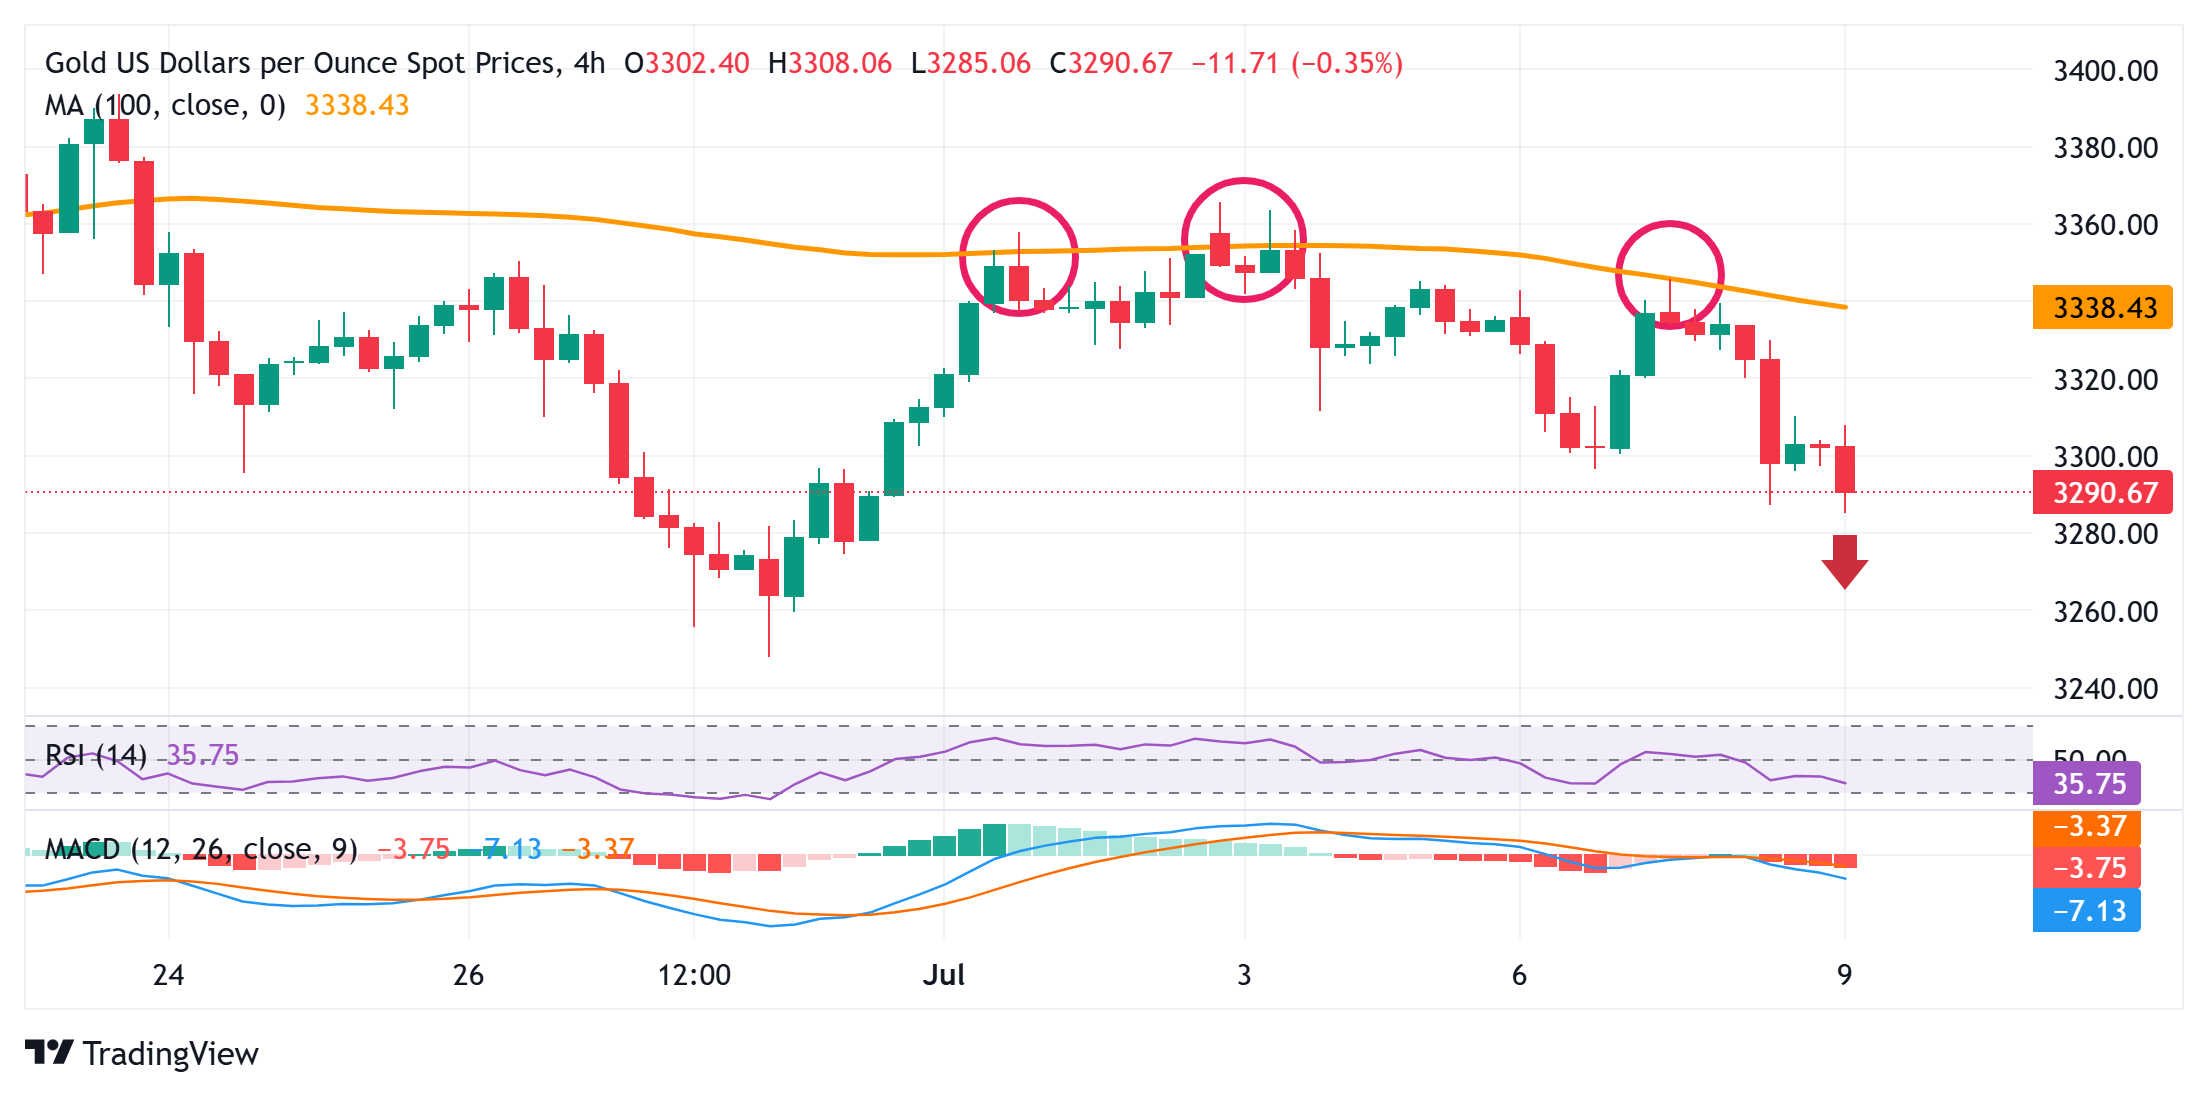
The overnight failure near the 100-period Simple Moving Average (SMA) pivotal resistance on the 4-hour chart and acceptance below the $3,300 mark could be seen as a key trigger for the XAU/USD bears. Moreover, oscillators on the daily chart have just started gaining negative traction and suggest that the path of least resistance for the Gold price is to the downside. Hence, a subsequent fall towards the next relevant support near the $3,270 horizontal zone, en route to the $3,248-3,247 region or the June monthly swing low, looks like a distinct possibility.
On the flip side, attempted recovery beyond the $3,310 immediate hurdle might now face some hurdle near the $3,326 area. Any further move up might continue to attract fresh sellers near the 100-SMA on the 4-hour chart, currently pegged near the $3,340 region. Some follow-through buying, leading to subsequent strength beyond the $3,359-3,360 supply zone, could trigger a short-covering move and allow the Gold price to reclaim the $3,400 round figure.
US Dollar PRICE Last 7 days
The table below shows the percentage change of US Dollar (USD) against listed major currencies last 7 days. US Dollar was the strongest against the Japanese Yen.
| USD | EUR | GBP | JPY | CAD | AUD | NZD | CHF | |
|---|---|---|---|---|---|---|---|---|
| USD | 0.86% | 1.33% | 2.59% | 0.31% | 0.95% | 1.83% | 0.79% | |
| EUR | -0.86% | 0.43% | 1.69% | -0.56% | 0.12% | 1.08% | -0.05% | |
| GBP | -1.33% | -0.43% | 1.28% | -0.99% | -0.37% | 0.62% | -0.51% | |
| JPY | -2.59% | -1.69% | -1.28% | -2.20% | -1.60% | -0.69% | -1.75% | |
| CAD | -0.31% | 0.56% | 0.99% | 2.20% | 0.65% | 1.62% | 0.49% | |
| AUD | -0.95% | -0.12% | 0.37% | 1.60% | -0.65% | 1.02% | -0.15% | |
| NZD | -1.83% | -1.08% | -0.62% | 0.69% | -1.62% | -1.02% | -1.13% | |
| CHF | -0.79% | 0.05% | 0.51% | 1.75% | -0.49% | 0.15% | 1.13% |
The heat map shows percentage changes of major currencies against each other. The base currency is picked from the left column, while the quote currency is picked from the top row. For example, if you pick the US Dollar from the left column and move along the horizontal line to the Japanese Yen, the percentage change displayed in the box will represent USD (base)/JPY (quote).
Recommended Articles


Comments (0)
Click the $ button, enter the symbol, and select to link a stock, ETF, or other ticker.