

Silver Price Analysis: Forms Triangle or Bull Pennant within a Measured Move
- Silver is forming a Symmetrical Triangle, or Bull Pennant continuation pattern with bullish implications for price.
- It is also probably rising up in the final wave C of a Measured Move price pattern, also with bullish expectations.
- MACD is poised to rise higher after crossing the zero-line.
Silver (XAG/USD) has formed a price pattern after its recent rally, which saw it break out of its falling channel.
The price pattern could either be a Symmetrical Triangle (ST) pattern, or perhaps a Bull Pennant continuation pattern; the first has slightly bullish connotations, the second has stronger bullish implications.
Silver Daily Chart
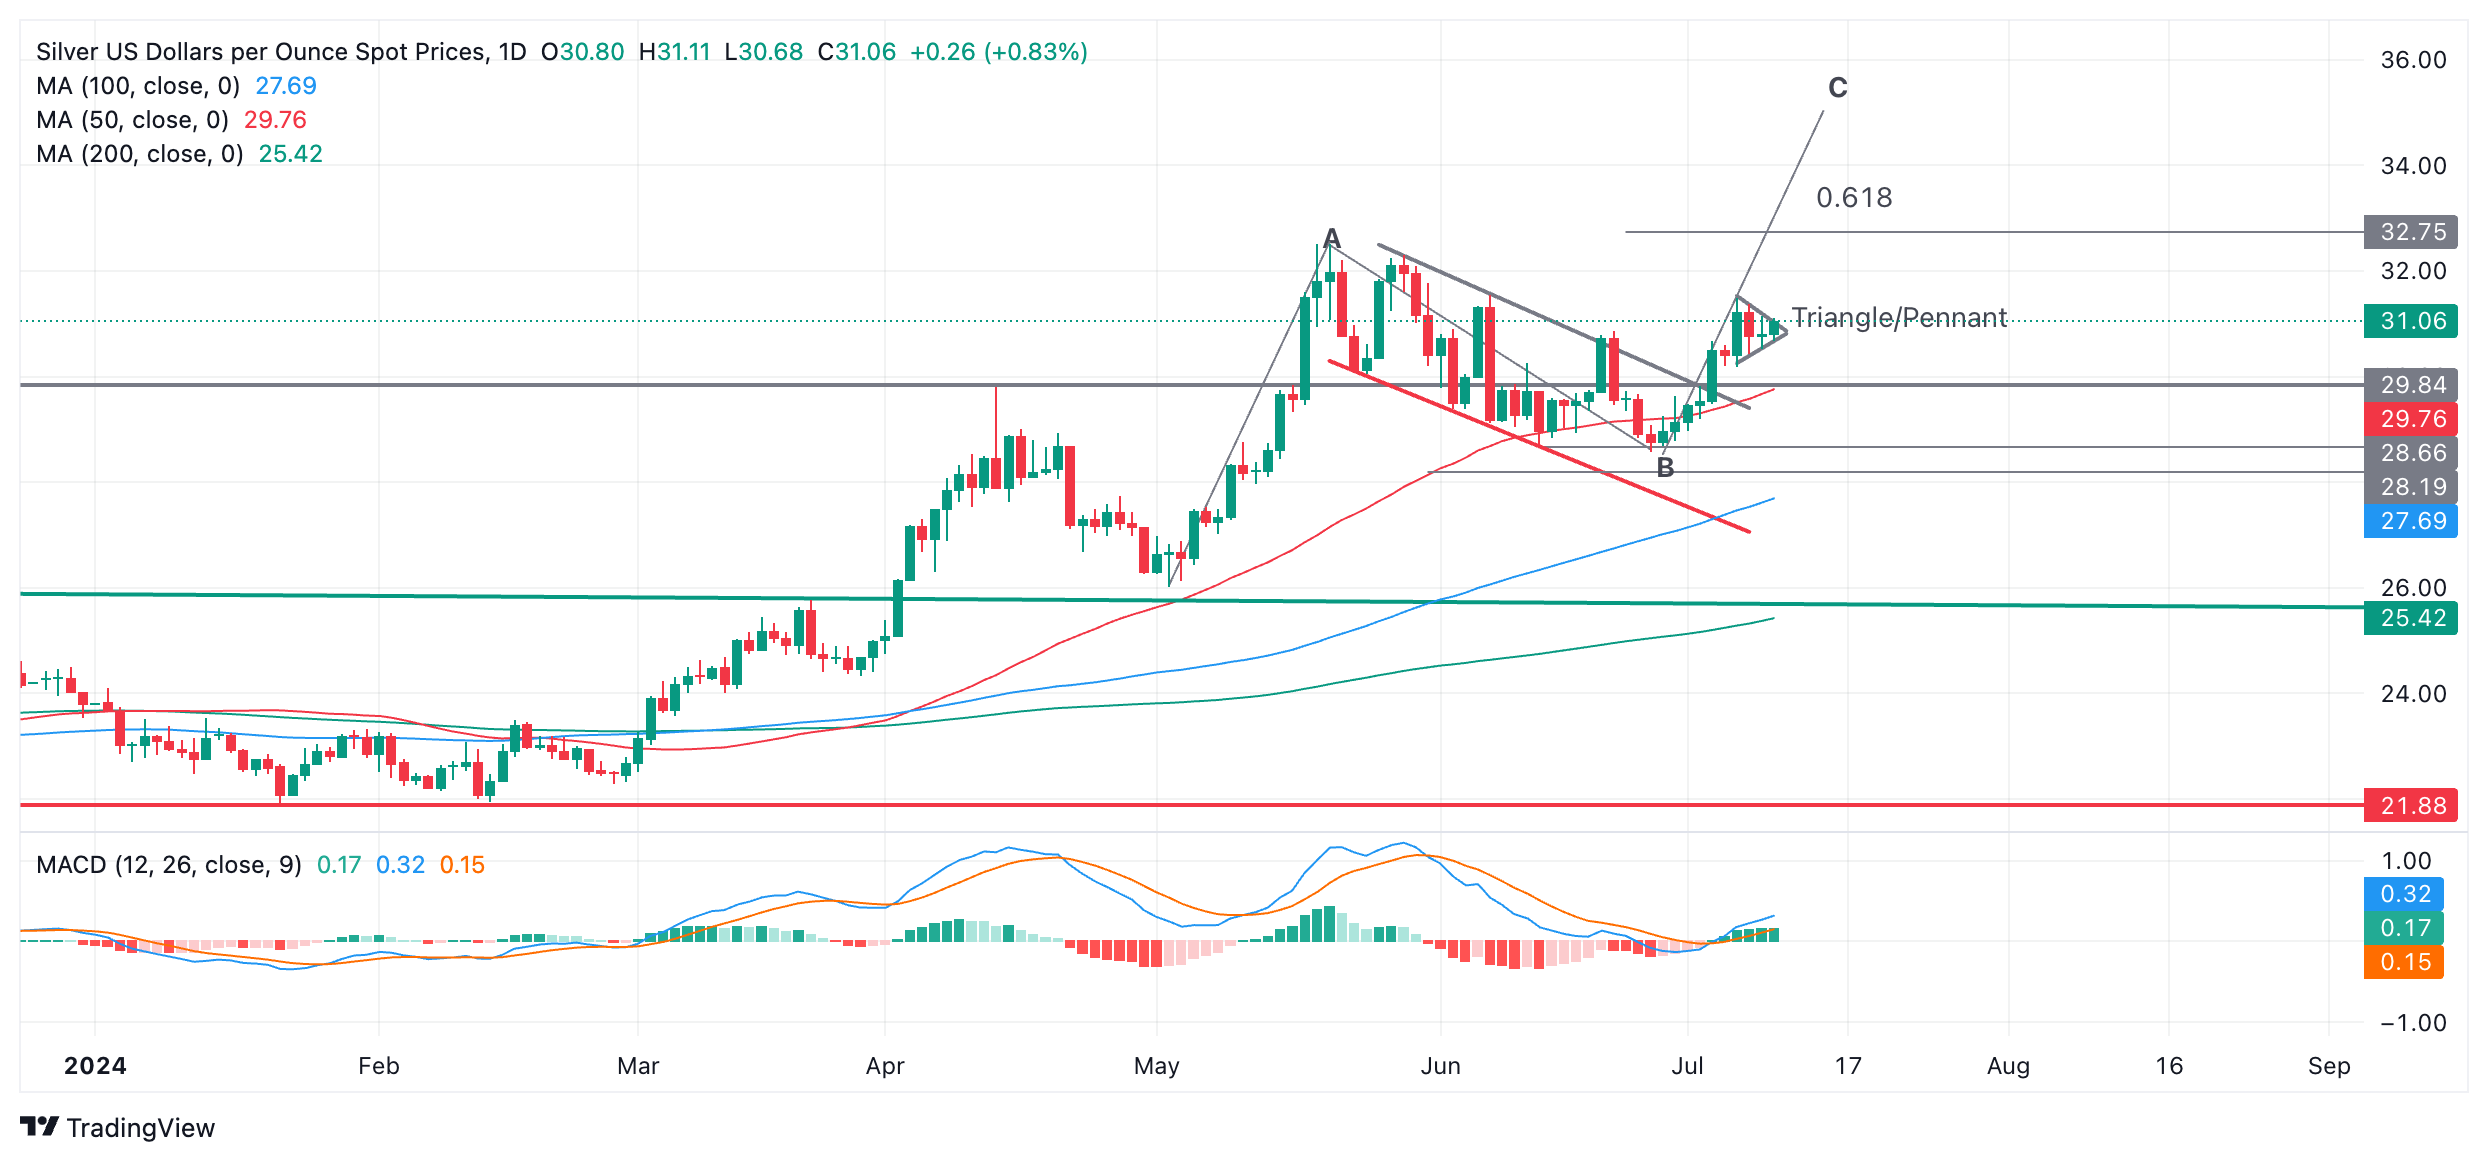
More broadly Silver is also probably in the process of rising up in the final wave C of a three-wave Measured Move (MM), with a final price target substantially higher than the current market level.
STs do not give a hint of the direction of the breakout but it is usually in the direction of the prior trend. Bull Pennants, however, are bullish and strongly suggest higher prices to come.
MMs are like large zig-zags composed of three waves, sometimes labeled A,B and C.
As Silver price is currently rising up in wave C it is likely to go higher, either till it reaches the end of wave C or, more conservatively $32.75 ( calculated as the 0.618 extrapolation of wave A). If it reaches the end of C it could rally to $35.00.
A break above the top of the ST/Pennant at $31.49 would provide confirmation of the next leg higher.
The Moving Average Convergence Divergence (MACD) momentum indicator has crossed above the zero line and looks poised to continue higher, with bullish implications for price.
Related Articles
Amazon Stock Predictions for 2026 to 2030: Will They Exceed Expectations and Achieve Major Long-Term Goals?
TradingKey - As we head into 2026, many investors are questioning where Amazon (AMZN) fits into the technology world.
A Crash After a Surge: Why Silver Lost 40% in a Week?
TradingKey - Spot silver (XAGUSD) prices continue to decline. Silver plunged 20% on Thursday, breaking below $71 per ounce, with the sell-off intensifying on Friday as prices fell further below $64. Compared to the all-time high set on January 29, silver prices have retraced more than 40%, wiping out nearly all gains accumulated over the previous month.
Is Bitcoin’s Four-Year Cycle Dead in 2026?
Is the Bitcoin 4-year cycle dead? After 2025 broke historical records with a red post-halving year, institutional analysts explore if the Bitcoin price has decoupled from the halving countdown. Analyze the impact of spot ETFs, global liquidity, and the roadmap to the 2028 halving in this 2026 market
USD Dollar Trend Forecast: Dollar Index Falls Below 97.0 to 4-Year Low, Will the Dollar Continue To Fall or Bottom Out in 2026?
TradingKey - In January 2026, the US Dollar Index continued its downward trend from 2025, officially breaking below the key 97.0 level and reaching a low of 95.5, marking a nearly four-year low since February 2022.

