

Nuscale Power Corp
SMRToday
-2.71%
5 Days
+2.77%
1 Month
-4.08%
6 Months
-33.44%
Year to Date
-22.83%
1 Year
-70.60%
TradingKey Stock Score of Nuscale Power Corp
Currency: USD Updated: 2026-06-22Key Insights
Nuscale Power Corp's fundamentals are relatively very healthy, and its growth potential is good.Its valuation is considered fairly valued, ranking 39 out of 66 in the Electric Utilities & IPPs industry.Institutional ownership is very high.Over the past month, multiple analysts have rated it as Hold, with the highest price target at 15.67.In the medium term, the stock price is expected to remain stable.Despite an average stock market performance over the past month, the company shows strong fundamentals and technicals.The stock price is trading sideways between the support and resistance levels, making it suitable for range-bound swing trading.
Nuscale Power Corp's Score
Support & Resistance
Score Analysis
Media Coverage
Nuscale Power Corp Highlights
Analyst Rating
Nuscale Power Corp News
Best Nuclear Energy Stocks and ETFs in 2026 — And How to Invest
This guide will tell you how the industry ended 2025, what makes 2026 potentially interesting, which nuclear energy stocks and ETFs are worth looking at, and how to invest in this space pragmatically.

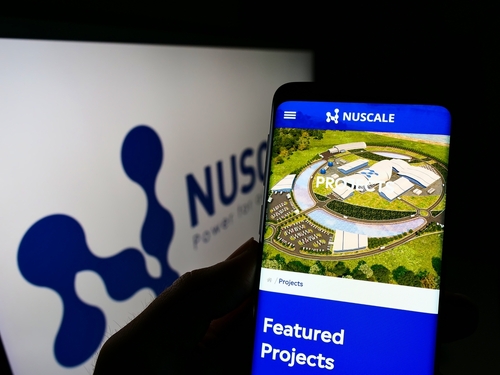
NuScale Power: Should You Take the Risk To Invest In Small Modular Reactors?
TradingKey - NuScale Power (OTC:SMR) is trying to establish a foothold in the energy space with small modular nuclear reactors (SMRs) — a theme touted as safer, less expensive, and more flexible than conventional nuclear power plants.
[IN-DEPTH ANALYSIS] Breaking AI's Energy Bottleneck: NuScale SMR, Pioneering a New Nuclear Era
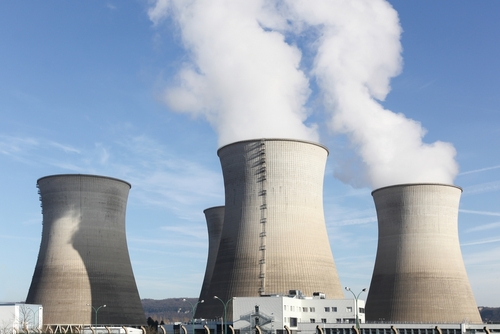
【In-Depth Analysis】TradingKey - Forget the image of massive nuclear plants costing billions and taking decades to build. While they’ve long been the backbone of the grid, they’re starting to feel clunky in today’s fast-evolving energy landscape.
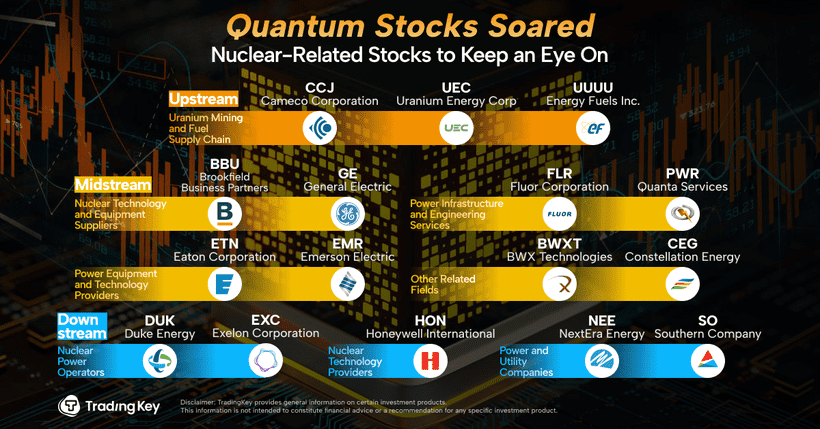
Riding the Quantum Wave? Don’t Miss the Nuclear Follow-Through
TradingKey - Quantum computing stocks have continued to surge, becoming one of the hottest areas in global equity markets. D-Wave is up more than 106% year to date, while IonQ posted a single-day gain of 36.5%.
Financial Indicators
EPS
Total revenue
Nuscale Power Corp Info
Related Instruments
Popular Instruments
