Energy
LIST1006Related Stocks
News
AI Computing Power War Extends to Power Sector: Microsoft Secures AI Power Guarantee, Signs 20-Year Power Supply Agreement With Chevron
TradingKey - On Monday, oil giant Chevron (CVX) announced a 20-year energy supply agreement with tech giant Microsoft (MSFT) to provide dedicated natural gas power support for the latter's planned hyperscale data center in West Texas.
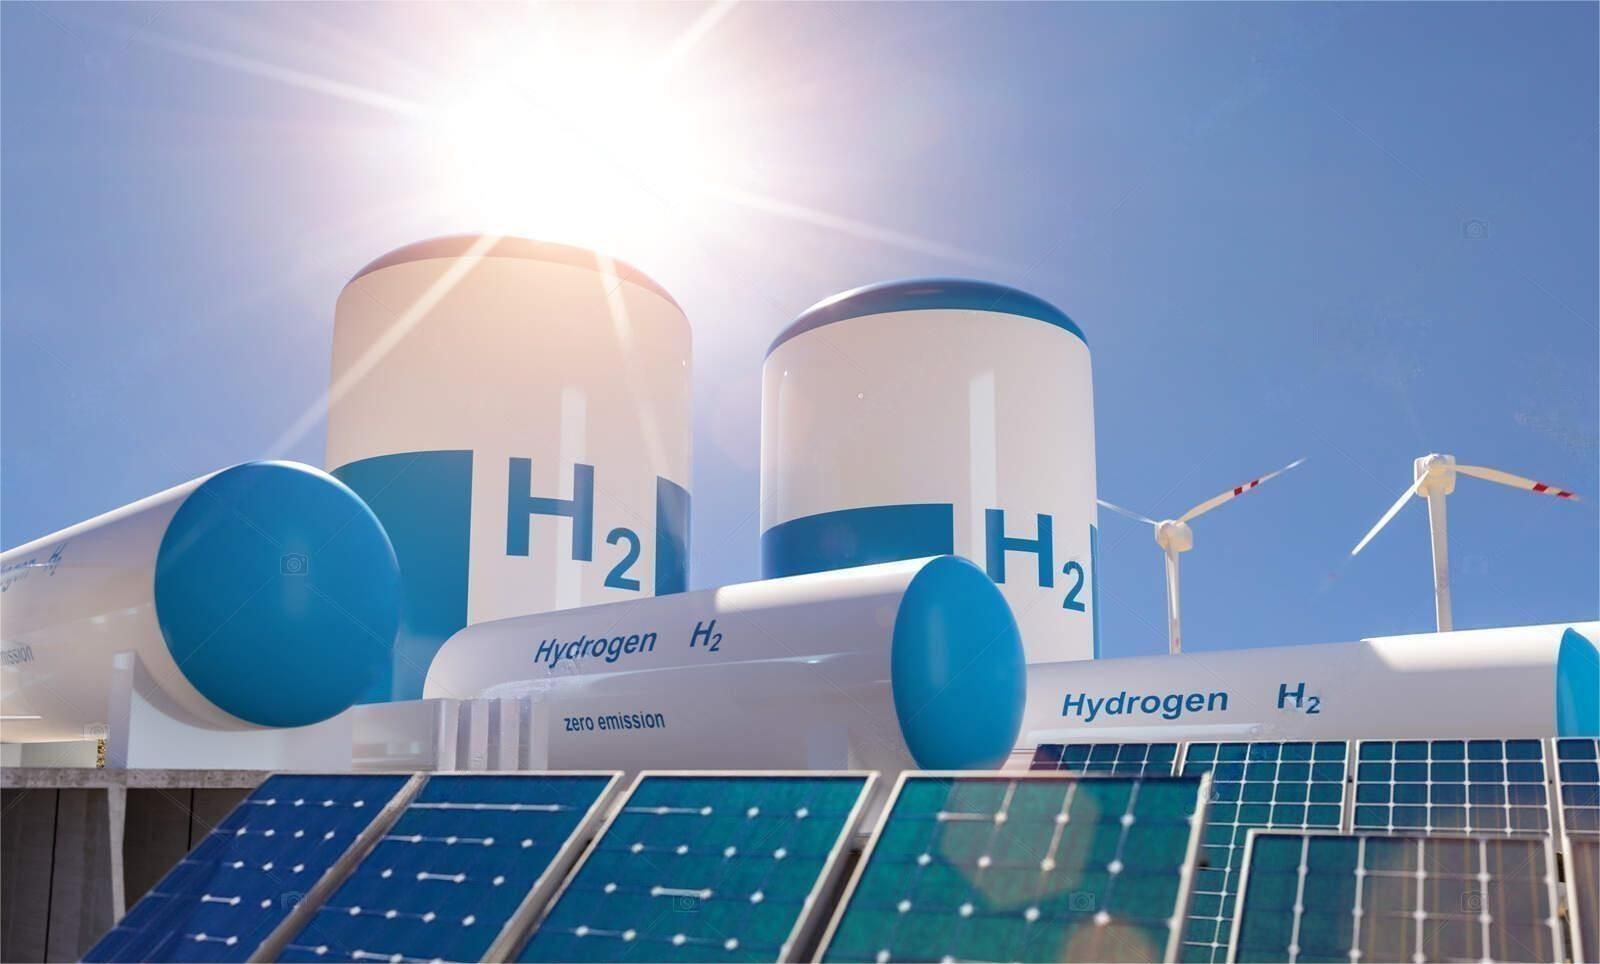
Is the End of AI Electricity? 2026 'Hydrogen Era' Arrives: A Guide to US and Taiwan Hydrogen Concept Stocks
TradingKey - Entering 2026, the global energy transition has officially entered the "hydrogen era." With breakthroughs in electrolyzer technology and the rollout of hydrogen infrastructure subsidies across various countries, hydrogen energy concept stocks have become the core of low-carbon asset allocation.
Top Oil and Gas Stocks to Buy in 2026 Amid Iran-US Conflict
Tradingkey - The Iran-US conflict has disrupted global oil and gas production by interrupting supply chains and damaging oil supply lines and pipeline infrastructures due to ongoing hostilities.According to the Energy Information Administration, in April, Iraq, Saudi Arabia, Kuwait, the United Arab

Is US-Iran Conflict About to End? Crude Oil Plummets, Gold Hits $4,500
TradingKey - U.S.-Iran tensions showed clear signs of easing on Wednesday (May 20), as crude oil markets plummeted and gold (XAUUSD) continued its rally.

PPI Report April 2026: How Inflation Data Is Moving HIMS, CEG, and PLUG Stock Today
TradingKey - Wall Street is navigating a two-day inflation gauntlet. Tuesday's CPI print for April arrived hotter than expected, rattling equity markets from telehealth to nuclear energy. Wednesday morning brings the Producer Price Index (PPI) for April — and if today's Consumer Price Index is any g

Enbridge Delivered Its 31st Consecutive Dividend Increase and a $40B Backlog — Is ENB a Buy at $53?
TradingKey - Enbridge Q1 2026 EBITDA C$5.8B, guidance C$20.2–20.8B reaffirmed, backlog $40B, 31st consecutive dividend hike. ENB at $53.53, bullish hammer at trendline. Target $54.30–$56.40.