


Nasdaq Returns to Correction Territory, Poised to Challenge 27,000 Again by End of 2026



AI Podcast


The Nasdaq has entered correction territory, trading within a wide 24,000–27,000 range amid a tug-of-war between tightening macroeconomic liquidity and AI fundamental realization. Persistent sticky inflation and resilient employment have kept the 10-year U.S. Treasury yield elevated near 5.1%, driving up discount rates and pressuring high-P/E tech stocks. Simultaneously, debate persists over the monetization timeline of record AI capital expenditures near $800 billion. Key catalysts include the upcoming Fed FOMC outlook and Nvidia’s quarterly report, which will dictate whether the index tests upper resistance or lower support levels.

TradingKey - The Nasdaq has fallen into correction territory for the second time and could remain stuck in a tug-of-war within a wide 24,000–27,000 trading range through the end of 2026.
After weathering a sharp drop in early November, the Nasdaq Composite Index officially confirmed its entry into correction territory. The index is currently consolidating between 25,100 and 25,200, hovering around 25,136.27. Looking ahead to 2027, the Nasdaq is expected to continue fluctuating at elevated levels and digesting market positioning within a wide range of 24,000–27,000.
In late May 2026, the Nasdaq breached 27,000 points before pulling back continuously to near 24,000 by late July. After carving out an interim bottom, the index rebounded strongly, topping 27,000 again on October 5 to set a new record high. However, it subsequently retreated, falling back to near 24,000 on November 5.
The Nasdaq's persistent fluctuations within the wide 24,000–27,000 range since May without achieving a sustained directional breakout reflect a prolonged tug-of-war in the U.S. tech sector between tightening macroeconomic liquidity and the tangible realization of AI fundamentals.
Since this summer, sticky U.S. inflation and resilient employment data have prompted the Federal Reserve (Fed) to turn more cautious on monetary policy, even facing renewed rate-hike expectations in the autumn. Consequently, the 10-year U.S. Treasury yield has remained anchored at an elevated level of around 5.1%. Meanwhile, the Nasdaq is heavily concentrated in growth stocks and tech giants that rely on distant future cash flows. With risk-free rates sustained above 5%, the discount rate demanded by the market has risen sharply, putting persistent pressure on high-P/E tech stocks and leaving the index without the macroeconomic liquidity needed for an unconstrained rally.
In 2026, aggregate capital expenditures by global cloud and AI giants continued to reach record highs, approaching $800 billion for the full year. However, the market debate has shifted from whether computing power demand is sufficient to when these massive investments will translate into tangible, sustainable operating profits. Whenever Big Tech earnings show expanding capex alongside friction in near-term monetization, concerns over AI overinvestment resurface, directly triggering corrections in core chip and computing stocks and preventing the Nasdaq from breaking above the 27,000 resistance zone.
Currently, market attention is focused on Fed testimony and the December FOMC meeting outlook regarding how AI investment impacts short-term inflation and the path of interest rates. Only if the 10-year Treasury yield retreats from its 5.1% high will valuation multiples for high-valuation growth stocks find breathing room. However, the current situation offers little cause for optimism, capping their upside potential.
In addition, the market is closely watching Nvidia's (NVDA) latest quarterly report and revenue guidance for the first quarter of 2027, which will directly verify whether cloud giants' computing procurement demand is experiencing a marginal slowdown. If the numbers beat expectations, the Nasdaq could form a double bottom near 25,000 points and test 26,500 points on the upside; conversely, if guidance is conservative, the broader market may further test support at 24,000–24,500 points.
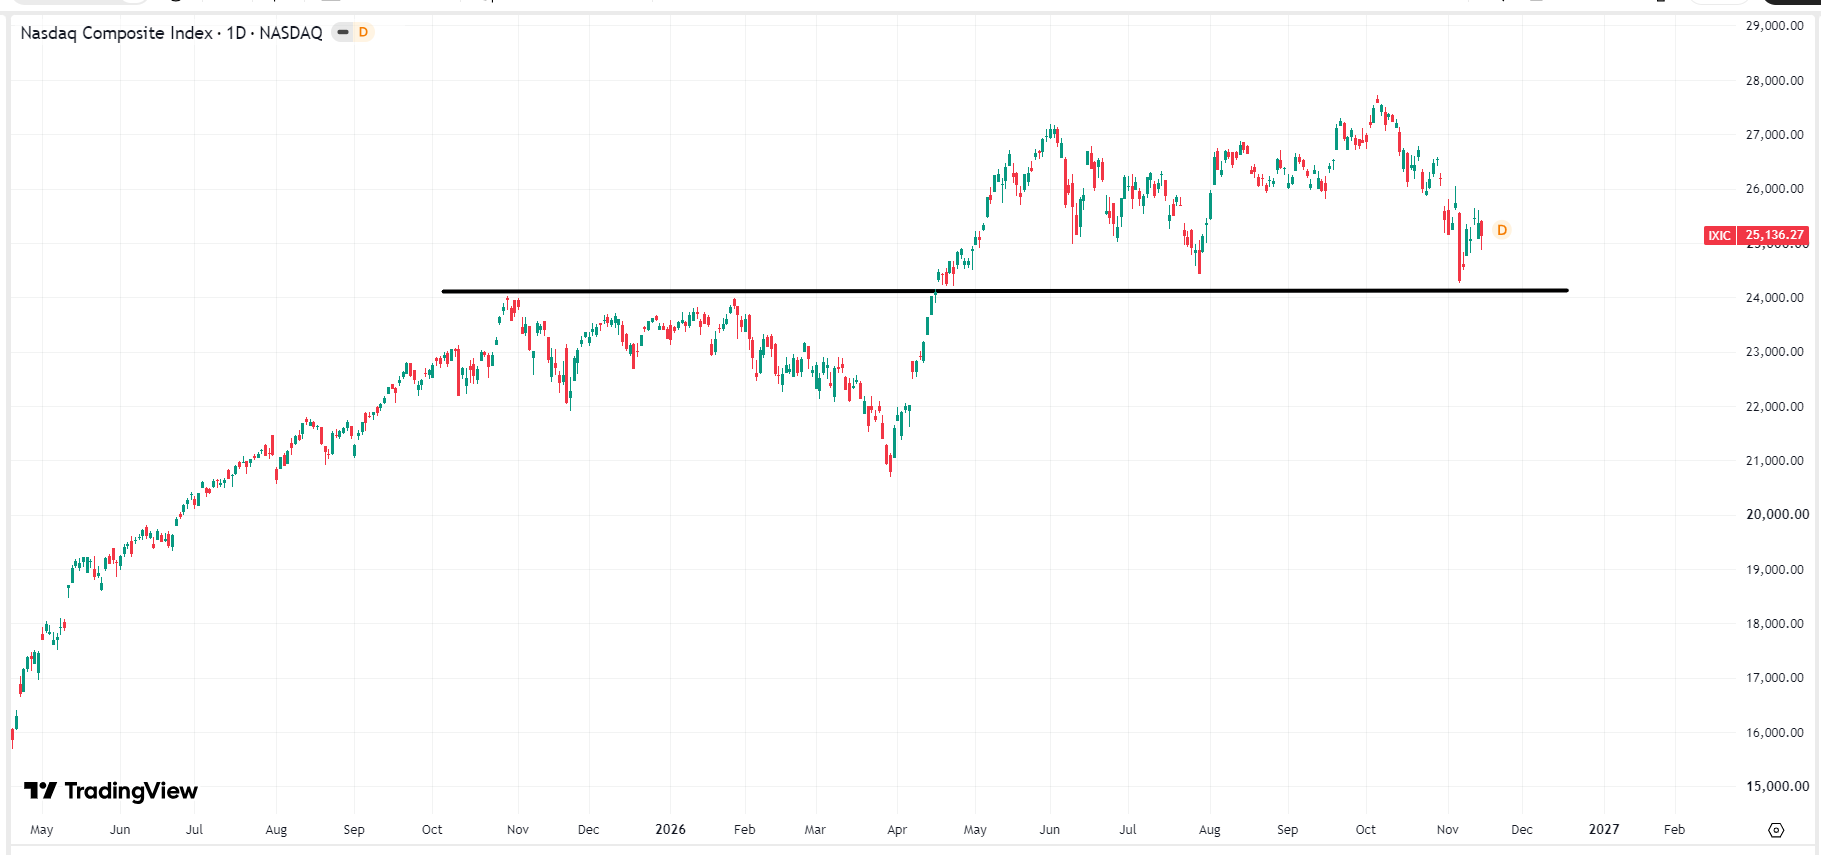 Nasdaq Index chart, Source: TradingView
This content was translated using AI and reviewed for clarity. It is for informational purposes only.
Recommended Articles







Comments (0)
Click the $ button, enter the symbol, and select to link a stock, ETF, or other ticker.