


Regeneron Stock Forecast: REGN Jumps 13% as Full Dupixent Profits Kick In, With $930.46 the Next Test



AI Podcast


Regeneron Pharmaceuticals surged 13.33% to $927.89 on Friday, October 30, following third-quarter results that significantly beat estimates. Revenue rose 36% to $5.12 billion, and non-GAAP EPS jumped 70% to $20.07, driven by full Dupixent profit recognition from Sanofi and record sales across key drugs. The companies also expanded their alliance with a new $1 billion upfront deal. Technically, the stock exhibits strong bullish momentum with the RSI in overbought territory at 79. While a short-term pause is possible, a daily close above $930.46 targets $961.85, with key support at $870.49.
TradingKey - Regeneron Pharmaceuticals (NASDAQ: REGN) jumped 13.33% to $927.89 on Friday, October 30, after third-quarter results beat estimates by a wide margin. It was the stock's highest close in at least a year, and it came on a day the S&P 500 fell 1.8%.
The key driver was Sanofi. Q3 was the first quarter Regeneron received its full share of Dupixent profits, after it finished repaying development costs that had been deducted from that share. The stock rose about 26% in October.
Q3 Beat by a Wide Margin
Revenue rose 36% to $5.12 billion, against about $4.58 billion expected, and non-GAAP EPS, which leaves out items such as stock-based pay, jumped 70% to $20.07, against an estimate of about $16.51, according to Trefis. GAAP EPS rose 35% to $18.45. CEO Leonard Schleifer called it "an outstanding quarter," with Dupixent, EYLEA HD and Libtayo each setting sales records.
Full Sanofi Profits Are the Real Story
Collaboration revenue from Sanofi rose 68% to $2.72 billion. Regeneron had been paying back its share of past development costs out of its Dupixent profits, and that balance was fully repaid at the end of Q2. From Q3 onward, the full profit share flows through, which makes this a lasting step-up rather than a one-time gain.
Dupixent, whose sales Sanofi records, grew 35% to $6.5 billion in the quarter, so the profit pool Regeneron shares in is still expanding.
EYLEA Is Close to Stabilizing
In the US, EYLEA HD sales jumped 62% to $699 million, while the original EYLEA fell 41% to $400 million. Together, the two brought in about $1.1 billion, down only about 1% from a year earlier, with EYLEA HD now nearly two-thirds of the total. The higher-dose version is now offsetting most of the decline. Libtayo, Regeneron's cancer drug, rose 51% to $550 million.
A Bigger Sanofi Deal
Regeneron also expanded its Sanofi alliance to cover four next-generation, long-acting immunology antibodies. Sanofi will pay $1.0 billion upfront, which Regeneron will book as collaboration revenue in Q4, plus up to $7.0 billion in milestones, and the two companies will share costs and profits equally. That gives Regeneron a path to extend its immunology business beyond Dupixent.
Other news added support, including a $270 million Inmazeb supply deal with BARDA for Ebola preparedness through 2031, and Libtayo data showing a 37% lower risk of death in high-risk skin cancer after nearly four years of follow-up.
Analysts and Risks
TD Cowen raised its target to $980 and Canaccord to $922, while Evercore trimmed its target to $850, according to StocksToTrade. After a 26% October rally, the stock already trades near several targets. The main risks are Regeneron's growing reliance on Dupixent and further declines in the original EYLEA. In my view, the Sanofi step-up looks durable, but much of it is now in the price.
Regeneron Technical Analysis: Daily Close Above $930.46 Could Open $961.85
The breakout shows clearly on the daily chart. REGN opened sharply higher on Friday, pushed through $870.49 and closed just below $930.46, the 227.2% Fibonacci extension, a level traders use to project how far a move can run. The uptrend is strong, with price well above the rising 50-day and 100-day EMAs, moving averages that give more weight to recent prices, at $784.71 and $761.50.
RSI, a momentum gauge that runs from 0 to 100, has jumped to about 79, well above 70, the overbought line, and the MACD, a trend-following momentum indicator, is climbing sharply. Momentum is strong, but after a move this large a pause or pullback would be normal.
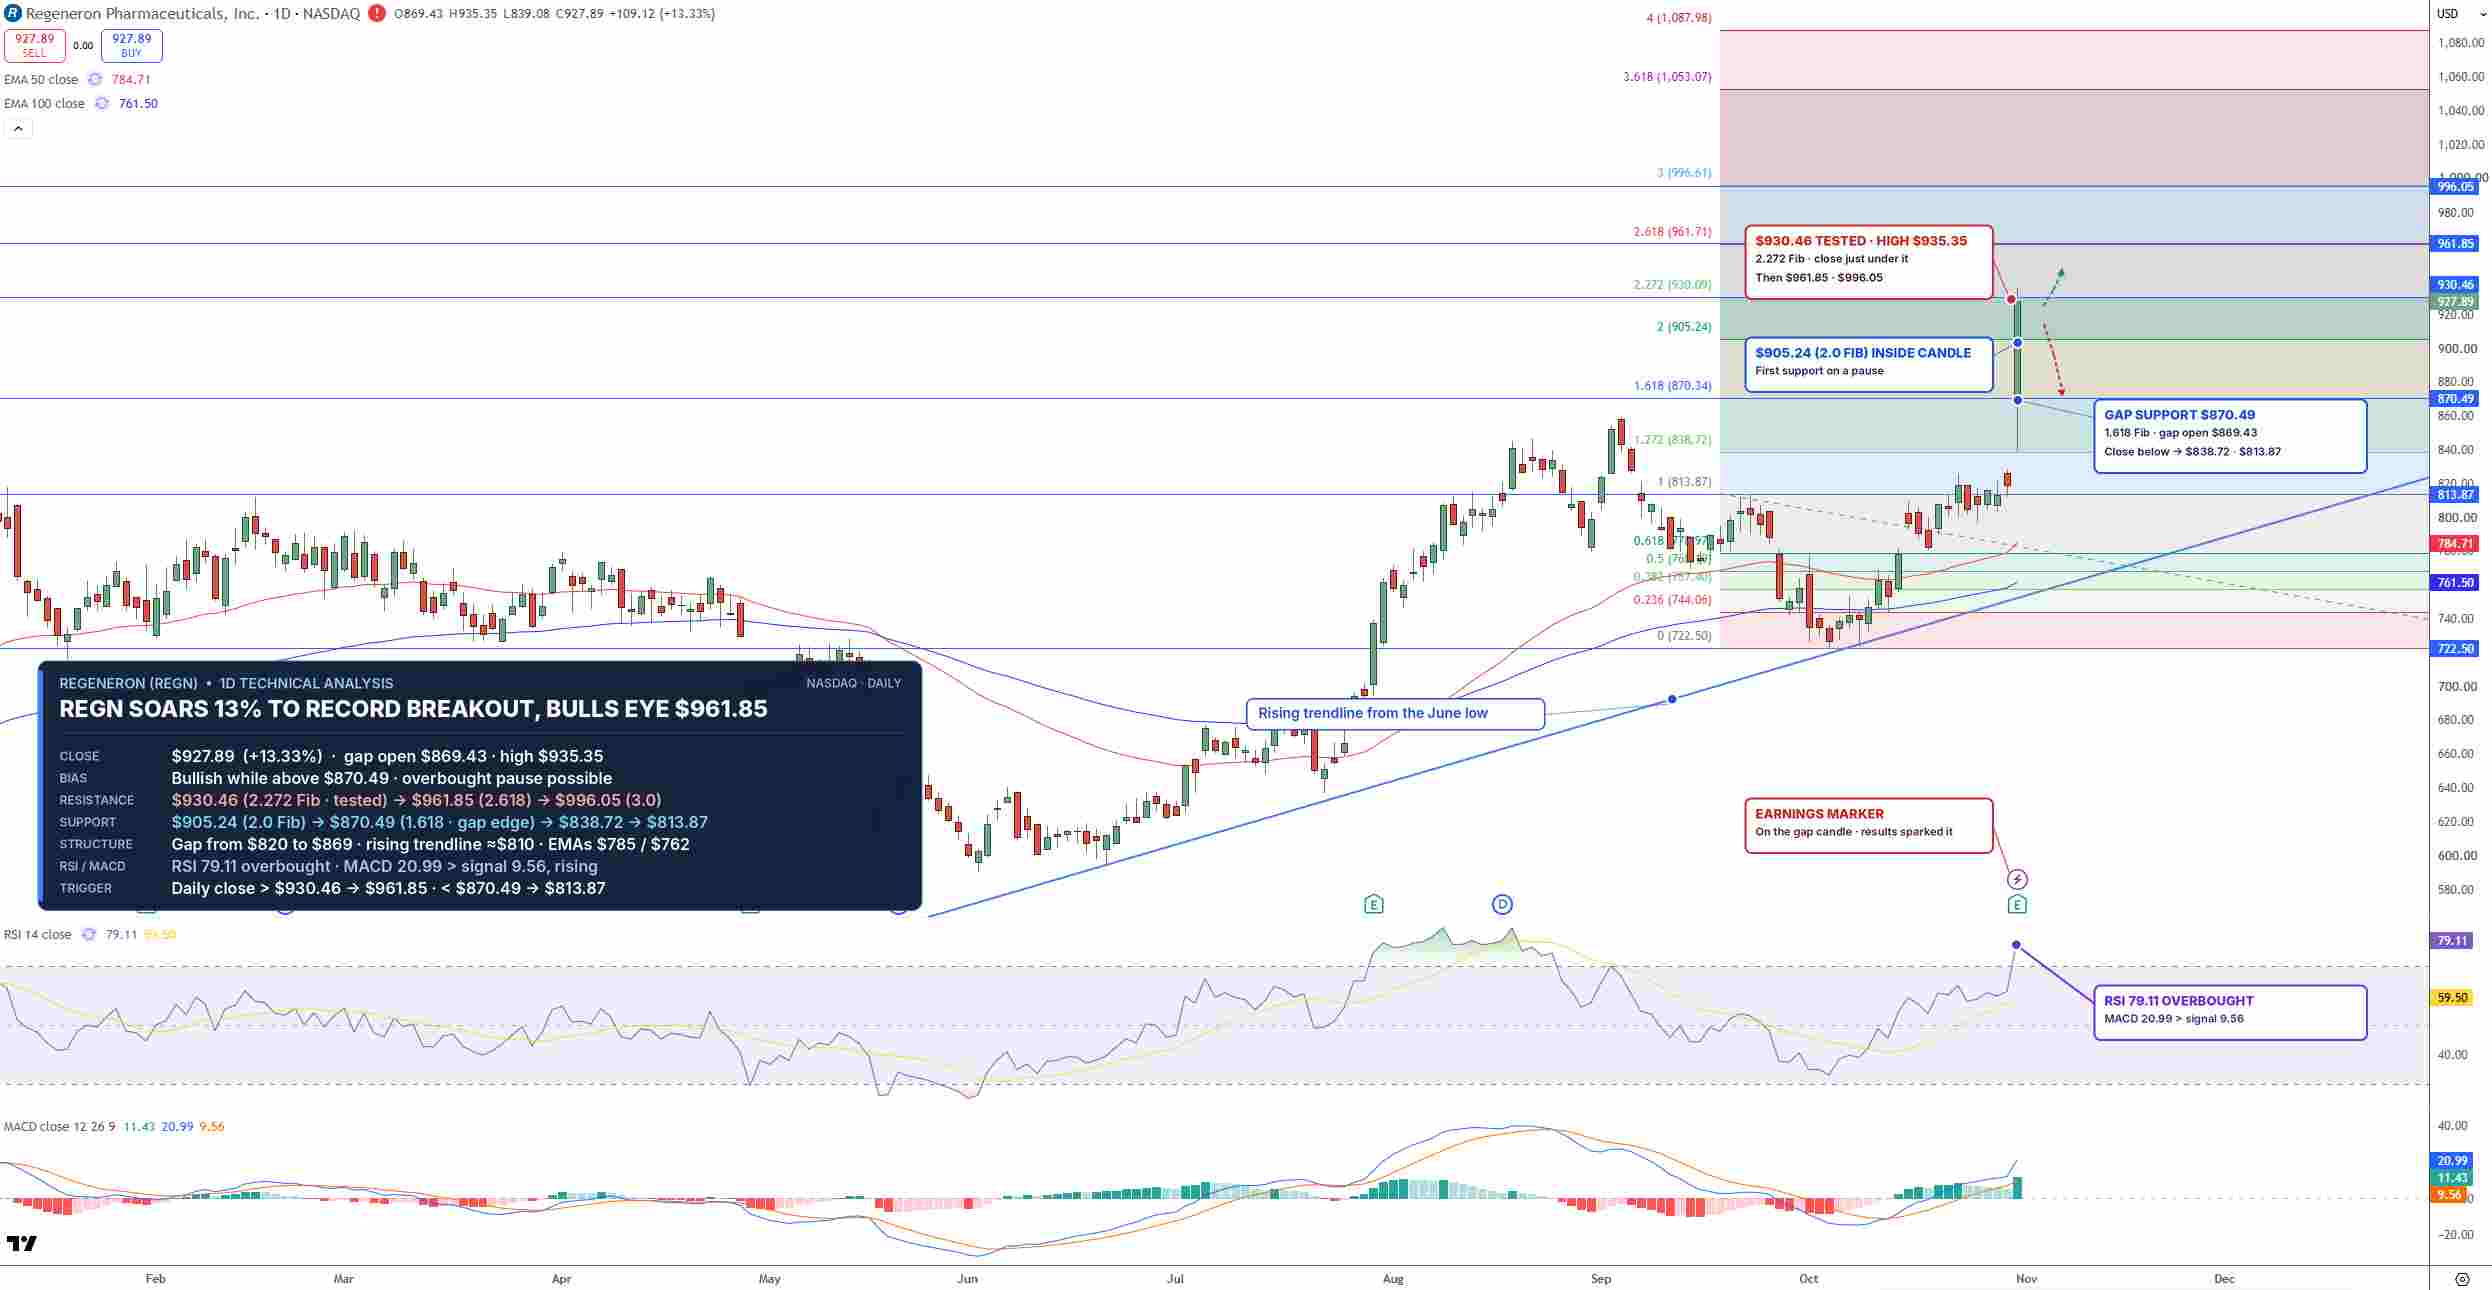
REGN Price Chart - Source: Tradingview
A daily close above $930.46 could open the way for $961.85, then $996.05. On the downside, $870.49 is now key support, and a close below it could send REGN back toward $813.87.
I'm bullish while REGN holds above $870.49, though overbought conditions could bring a short pause first.
Key Levels
- Last close: $927.89, up 13.33% on Friday, October 30
- Support: $870.49, $813.87, $784.71
- Resistance: $930.46, $961.85, $996.05
- RSI: 79.11, deep in overbought territory
- Bullish trigger: Daily close above $930.46
- Bearish trigger: Daily close below $870.49
FAQs
Why did Regeneron stock jump after earnings?
Regeneron rose 13.33% on Friday after Q3 revenue of $5.12 billion and non-GAAP EPS of $20.07 beat estimates by a wide margin, helped by its first quarter of full Dupixent profits from Sanofi and a new Sanofi deal worth $1 billion upfront.
What is the Regeneron stock forecast now?
The bias is bullish above $870.49 on the daily chart. A daily close above $930.46 targets $961.85 and $996.05, while a close below $870.49 opens $813.87.
Bottom Line
Regeneron's quarter showed a lasting earnings step-up from full Dupixent profits, not just a one-time beat. The level that matters is $930.46. I expect a short pause with RSI this high, but a daily close above it would open $961.85, while a close below $870.49 would weaken the breakout.
Recommended Articles








Comments (0)
Click the $ button, enter the symbol, and select to link a stock, ETF, or other ticker.