


Western Digital Stock Price Forecast: Will Upcoming Q1 Earnings Push Stock Back to $400?



AI Podcast


Western Digital is set to report its fiscal Q1 2027 earnings on October 22 ET, with consensus expecting a 47% revenue increase and 130% EPS growth. Investor focus centers on gross margin sustainability above 55.5% and AI-driven high-capacity HDD demand. Technically, the stock has rebounded for three consecutive days, reclaiming short-term moving averages. However, it faces key overhead resistance near the 20-day moving average at $400. Strong earnings, guidance, and margins could support a breakout toward $445, while falling short risks a downward test of the $330 support level.

TradingKey - On October 22 ET, Western Digital (WDC) will report its first-quarter fiscal 2027 earnings report after the market close today. Following a major pullback from June to October, WDC's stock price has recently rebounded for three consecutive trading days, closing at $378.51 on October 21, up 3.89%, with an intraday high of $381.88; over the past three trading days, it has accumulated a rebound of about 14%. As the earnings report approaches, can the stock price break through the key overhead resistance level of $400?
WDC Earnings Preview: Revenue Expected to Grow Nearly 47%, Continued Gross Margin Expansion Is Key
From the perspective of market expectations, consensus estimates currently project quarterly revenue at approximately $4.14 billion to $4.16 billion, representing a year-over-year increase of about 47%; adjusted EPS is expected to be around $4.07 to $4.09, up approximately 130% from $1.78 in the same period last year. The company's previous official guidance called for revenue of $4.1 billion ± $100 million and non-GAAP EPS of $4.00 ± $0.15.
For this earnings report, the primary area of focus for investors is gross margin. WDC previously projected Q1 non-GAAP gross margin to reach 55%–56%, with a midpoint of 55.5%, higher than 54.4% in the previous quarter. In the prior fiscal quarter, the company's revenue increased by 44% year-over-year to $3.747 billion, while non-GAAP gross margin expanded by 1,310 basis points year-over-year. Therefore, if the actual gross margin continues to remain above around 55.5%, it suggests that high-capacity HDD pricing and product mix can still support profitability; if it falls below 55%, the market may re-evaluate the pace of continued margin expansion.
The second key focus is high-capacity HDD demand driven by AI and cloud data centers. WDC currently provides high-capacity hard drives primarily to hyperscale cloud providers and enterprise data centers, where the growing data generated by AI training and inference has increased demand for cost-effective, large-scale storage. The market will focus on exabyte shipment growth, long-term supply agreement pricing, and Cloud segment demand this quarter. Last quarter, company revenue grew 44%, but storage capacity shipments increased by approximately 22%, indicating that price and product mix made a significant contribution to revenue growth; if shipment growth accelerates in tandem this quarter, it will provide more volume-driven growth data.
From the perspective of stock price performance, if revenue and EPS beat expectations, gross margin remains at or above 55%–56%, and strong next-quarter revenue and cloud demand guidance is provided, the stock price may gain support to rebound further. However, if results meet targets but gross margin, shipments, or next-quarter guidance fall short of expectations, the stock price could come under renewed downward pressure.
WDC Stock Price Technical Analysis
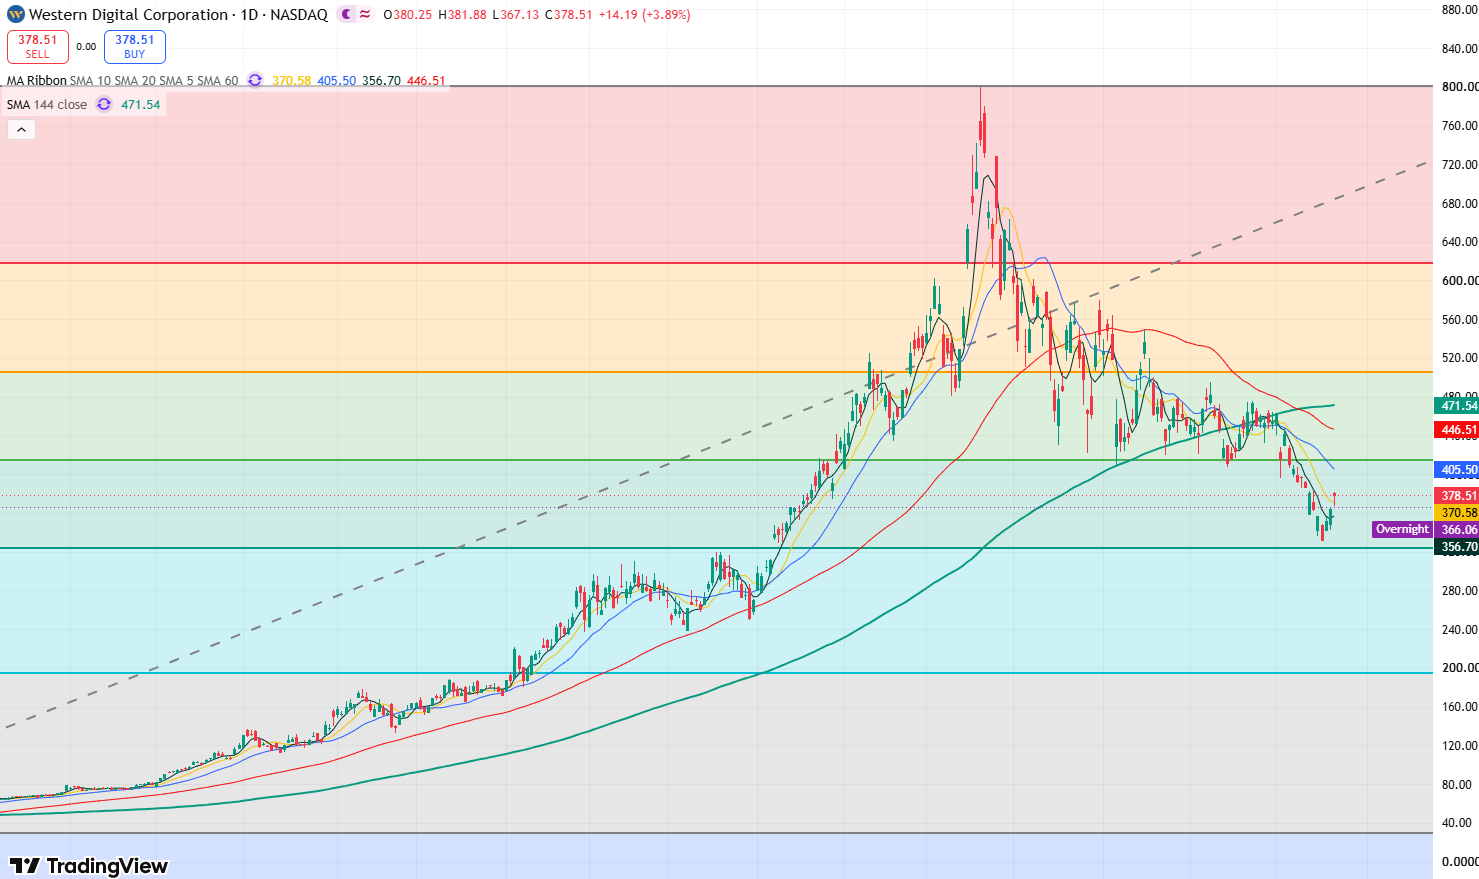
WDC daily stock chart, Source: TradingView
Looking at WDC's daily chart, after plunging 6.86% to $332 on October 16, the stock rebounded for three consecutive trading days and reclaimed its 5-day and 10-day moving averages, indicating an improvement in the short-term bullish structure. However, the stock has yet to break above its 20-day and 60-day moving averages, showing that the medium-term trend remains bearish.
Currently, the primary resistance level to watch on the upside is the 20-day moving average near $400. If the stock can firmly hold above $400, the next resistance level to watch is near the 60-day moving average around $445. A decisive breakout and consolidation above this level could open up upside space toward $500.
On the downside, the primary support level to watch is $330. If this level is breached, the stock will test the key support zone of $320-$310. A drop below $310 could trigger a deeper pullback toward $250.
This content was translated using AI and reviewed for clarity. It is for informational purposes only.
Recommended Articles












Comments (0)
Click the $ button, enter the symbol, and select to link a stock, ETF, or other ticker.