


Meta Stock Forecast: Q3 Beat Fades Below $721.79 as Cash Flow Turns Negative



AI Podcast


Meta Platforms reported stronger-than-expected third-quarter revenue of $64.6 billion and EPS of $3.83, alongside upbeat fourth-quarter guidance, despite a $9.89 billion legal charge impacting operating income. The core advertising engine remains robust, driven by higher ad impressions and pricing. However, heavy capital expenditures pushed free cash flow into negative territory, straining the balance sheet and narrowing the cash cushion over debt. Additionally, Meta announced a planned issuance of non-voting Class C shares to preserve voting control while facilitating capital raising. Technically, the stock remains range-bound, maintaining a neutral to slightly bullish bias while trading above key support at $686.49.
TradingKey - Meta Platforms (NASDAQ: META) closed at $697.43 on Wednesday, October 21, up 0.46%, then traded as high as $724 in the after hours session on its Q3 report. Most of that move higher faded, and current quotes are trading at around $704.50.
The quarter was better than expected on both lines and EPS, with Q4 guidance also coming in higher. Free cash flow for the quarter turned negative. The cash cushion over debt has almost evaporated, explaining why there has not been a breakout on the upside despite the beats.
Q3 Beat on Revenue, Legal Charge Hit Profit
Revenues for the third quarter were $64.6 billion, an increase of 26% and $1.3 billion above consensus. Diluted EPS was $3.83, above the $3.57 consensus. Operating income declined 37% to $12.99 billion and the operating margin declined to 20% from 40%, largely due to a $9.89 billion charge related to the state attorneys general youth-related harm settlement.
Absent the charge, operating income would have increased to $22.88 billion and EPS would have been $7.40. Net income was $9.86 billion.
The Ad Engine Is Still Running Hot
Impressions of ads shown were up 10% and the average price of an ad went up 14%, with prices in the U.S. and Canada going up 23%. Daily active people on Meta's apps was 3.64 billion, up 3% and the average time spent per person per day increased by 4%. About 10 million advertisers used generative AI ad tools this quarter.
Guidance Tops Expectations
Revenue for Q4 is expected to be between $73 billion and $76 billion. The midpoint, at $74.5 billion, is above the Wall Street consensus of $73.6 billion. Full year expenses were expected to be between $175 billion and $179 billion, with the increase expected to cover legal costs. Meta is still predicting that, after adjusting for the legal costs, their operating income for 2026 would be greater than 2025.
There is no revenue outlook for 2027 at this time, but Meta said they expect "strong overall revenue growth throughout 2027." Losses for Reality Labs were expected to be in the range of $15 billion for 2027, down from $18 to $19 billion in 2026.
Capex Is Draining the Cash Cushion
Q3 capex reached $34.91 billion against $32.79 billion of operating cash flow, so free cash flow was negative $2.12 billion. Meta narrowed 2026 capex guidance to $135 billion to $145 billion, raising the floor from $130 billion, and gave no 2027 figure.
The balance sheet shows the strain. Cash and marketable securities stood at $82.45 billion against $80.92 billion of long-term debt, after debt rose $22.2 billion in nine months. Meta has made no buybacks this year. In my view, the 2027 capex number in January matters more for the stock than any single quarter of ad growth.
Class C Shares: A New Funding Tool
Each of the Class A and Class B shares will get one non-voting Class C share for each share held, about a two-for-one split. The new charter takes effect on January 19, 2027, and Meta plans to list Class C shares on the Nasdaq. A special committee said that the Class C shares allow Meta to raise capital and pay and reward employees and fund acquisitions without diluting voting control.
Governance is the trade-off. Entities associated with Mark Zuckerberg hold 56.1% of the voting power and approved the changes by written consent, so the other shareholders didn’t vote. Following the dividend, Zuckerberg and his associates will hold about 60.6% of the voting power over about 13.4% of the economics of the company.
Meta Technical Analysis: Daily Close Below $686.49 Could Open $657.91
On the daily chart, META has pulled back from the September peak at $778.95 and is now testing the rising trendline from the August low which is around the 38.2% Fibonacci retracement level at $686.48. The latest candle left a long upper wick. After buyers pushed the price up to $713.22, sellers drove it back down. This demonstrates that there is still supply at $721.79. The two moving averages at $681.08 and $654.14 are still sloping up and below the price, so the bigger picture uptrend is still in effect.
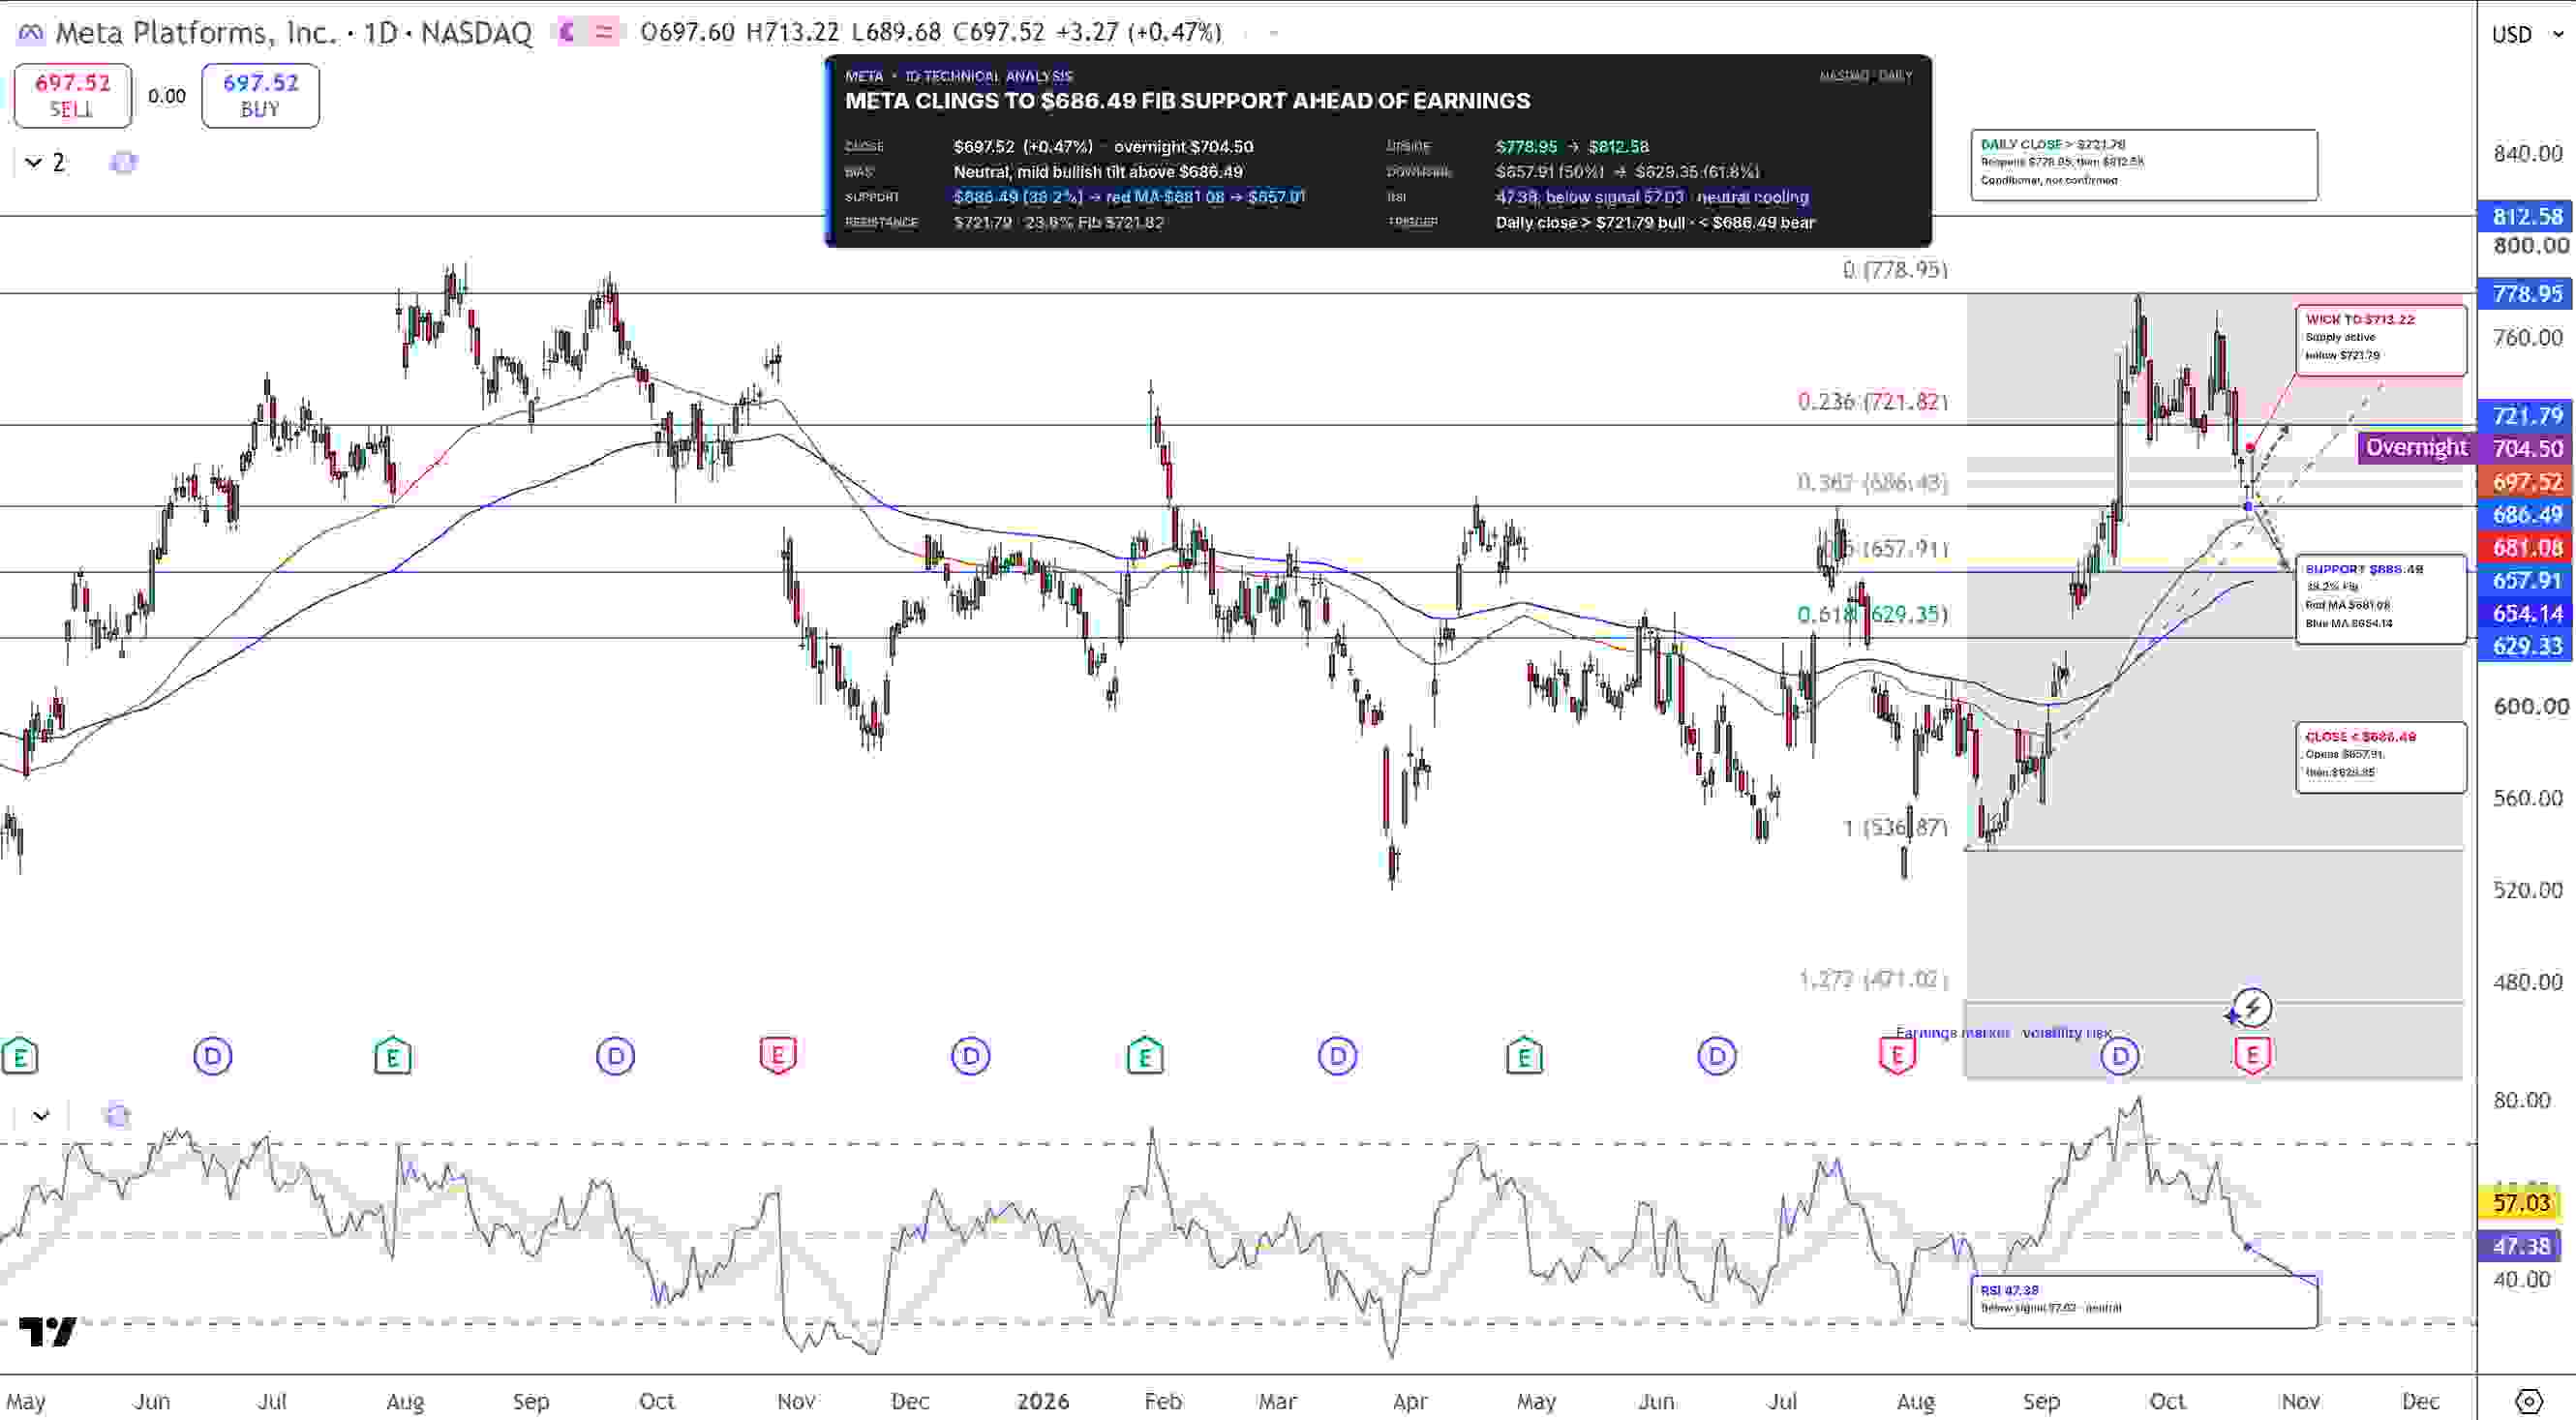
RSI is at 47, below its signal line, and just above 40. From where it has been lately, it is showing signs of consolidation rather than a major bearish move.
META traded above $721.79, the 23.6% Fibonacci retracement, in after hours, but did not close there. If META closes above $721.79, it would open a path to the $778.95 level. If it breaks $686.49, the trendline, and the 38.2% level, the 50% retracement level comes in at $657.91. Neutral with a slight bullish bias is where I’d be with META as long it stays above $686.49.
Key Levels
Last close: $697.43, up 0.46% on October 21
Support: $686.49, $681.08, $657.91, $629.35
Resistance: $713.22, $721.79, $778.95, $812.58
RSI: 47.38, below its 57.03 signal line
Bullish trigger: Daily close above $721.79
Bearish trigger: Daily close below $686.49
FAQs
Did Meta beat Q3 2026 earnings expectations?
Yes. Revenue of $64.6 billion beat the estimate of about $63.3 billion, and EPS of $3.83 beat the expected $3.57, despite a $9.89 billion legal charge. Guidance for Q4 revenue of $73 to $76 billion also beat estimates.
What is the Meta stock forecast after earnings?
The bias is neutral to slightly bullish above $686.49. A close above $721.79 would set a new uptrend targeting $778.95 and $812.58. A close below $686.49 would bring $657.91 and $629.35 into play.
Bottom Line
While Meta's ad business continues to improve, free cash flow has turned negative due to high capex. A close above $721.79 would be bullish, but the after-hours move failed to hold this level, so I expect the stock to continue being range-bound between $686.49 and $721.79. A close below $686.49 would be bearish.
Recommended Articles








Comments (0)
Click the $ button, enter the symbol, and select to link a stock, ETF, or other ticker.