


Tesla Stock Forecast: Q3 Margin Rebound Fails to Hold $387.75 Breakout After Hours



AI Podcast


Tesla reported mixed Q3 results, beating adjusted EPS estimates of $0.45 with $0.48 and improving gross margins, despite flat revenue and a 56% plunge in operating income to $718 million due to soaring R&D and compensation costs. Free cash flow reached $1.53 billion, supported by increased payables, while management cut 2026 capex guidance to approximately $20 billion. Robotaxi revenue was pushed to 2027, and no SpaceX merger updates were provided. Shares fell over 3% post-earnings. Technicians eye a symmetrical triangle pattern, with a bullish breakout above $387.75 and bearish downside risk below $366.60.

TradingKey - Tesla (TSLA) closed at $386.47 on Wednesday, up 3.41% ahead of its Q3 report. Shares moved up about 2% with the release, but trended down during the call and ended down about 3.3% to $373.60. Selling continued after hours and quotes at $369.75 showed shares moving down to that level.
Tesla beat the Q3 estimates on adjusted EPS, margins and free cash flow improved, and the 2026 capex plan was cut to about $20 billion. Nothing moved the stock as operating income still fell 56%, and no new info was given about the SpaceX merger.
Q3 Beat on EPS, but Operating Income Fell 56%
Revenue was $28.05 billion, relatively flat from the year prior and close to the $28 billion consensus. Adjusted EPS was $0.48 and beat the $0.45 estimate. This was down from the $0.50 a year prior. GAAP net income was $787 million and $0.22 per share, down 43% from the year prior, and down from the second quarter. It was helped by an unrealized gain of $288 million from Tesla's bitcoin investments.
Operating income was $718 million and down 56% from the year prior. The operating margin improved to 2.6% from the second quarter's 1.4%, but down from the year prior at 5.8%.
Margins Recover as Credits Fade
Total gross margin improved to 19.6% in Q3, from 18.0% a year ago and 16.8% in Q2, driven by stronger automotive gross margins, even as regulatory credits fell. Automotive gross margin (excluding regulatory credits) increased to 18.1% in Q3, from 16.3% in Q2 and 15.4% a year ago. Regulatory credits, however, declined to $113 million in Q3, from $417 million a year ago.
Automotive revenue was down 3% to $20.56 billion in Q3, and automotive deliveries were down 2% to 486,532. Battery availability was the main constraint on volumes, according to the company, but it ended the quarter with its highest passenger vehicle backlog in four years. Tesla’s Energy revenue was down 16% to $2.88 billion, and Other (Services and Products) revenue increased by 33% to $4.61 billion. Gross profit for Other (Services and Products) more than doubled to $734 million in Q3.
Spending Is Growing Faster Than Gross Profit
Total operating expenses for the quarter increased by 38.7% to $4.78 billion, mainly due to higher R&D (up 69% to $2.76 billion) and stock-compensation related expenses (up 76% to $1.17 billion). Improving margins, alone, cannot benefit operating income as long as revenue remains flat.
Capex Cut to $20 Billion, but Cash Flow Leaned on Payables
Free cash flow was $1.53 billion, negative $1.09 billion in Q2 and $3.99 billion a year ago. Q3 capex was $4.73 billion, down from $5.79 billion in Q2, and during the call, CFO Vaibhav Taneja, reduced the 2026 capex guidance from more than $25 billion to approximately $20 billion. With $13.01 billion spent through September, it would mean about $7 billion for Q4.
The cash flow beat is softer than it looks. Working capital added $2.59 billion to operating cash flow of $6.26 billion, mainly due to an increase in payables, accrued and other liabilities. Taneja also said that capex will increase in the next few years, and cash flow from operations will decrease. Tesla ended the quarter with $45.4 billion in cash and investments.
Robotaxi Revenue Moves to 2027
Musk said that the launch of the service will not “move the needle” this quarter, and should become more “noticeable” in Q2 2027. Tesla is launching the service in Dallas next month and, according to Musk, customer-owned vehicles may be able to join the service in Q2 2027. The number of active FSD users was 1.74 million, an increase of 67 percent from last quarter, and includes a purchase of the service.
SpaceX Merger: Nothing New
No merger questions were taken during the call for Tesla. Musk stated he "tap danced through a minefield" the day prior and did not see any reason to address it further. He said special committees from both companies are currently reviewing possible terms of the deal. No terms have been agreed upon.
Tesla Technical Analysis: Daily Close Below $366.60 Could Open $349.93
Since the July high of $432.76, Tesla has been stuck in a symmetrical triangle on the daily chart. The upper trendline of the triangle was tested yesterday, and as seen in prior attempts, the upper boundary of the triangle has been strong resistance and is currently around the $387.75 level. Symmetrical triangles are continuation patterns, and often a break outside of the pattern leads to the next major move in that direction. Tesla is currently trading back at recent support of the $370.73 and $366.60 moving averages.
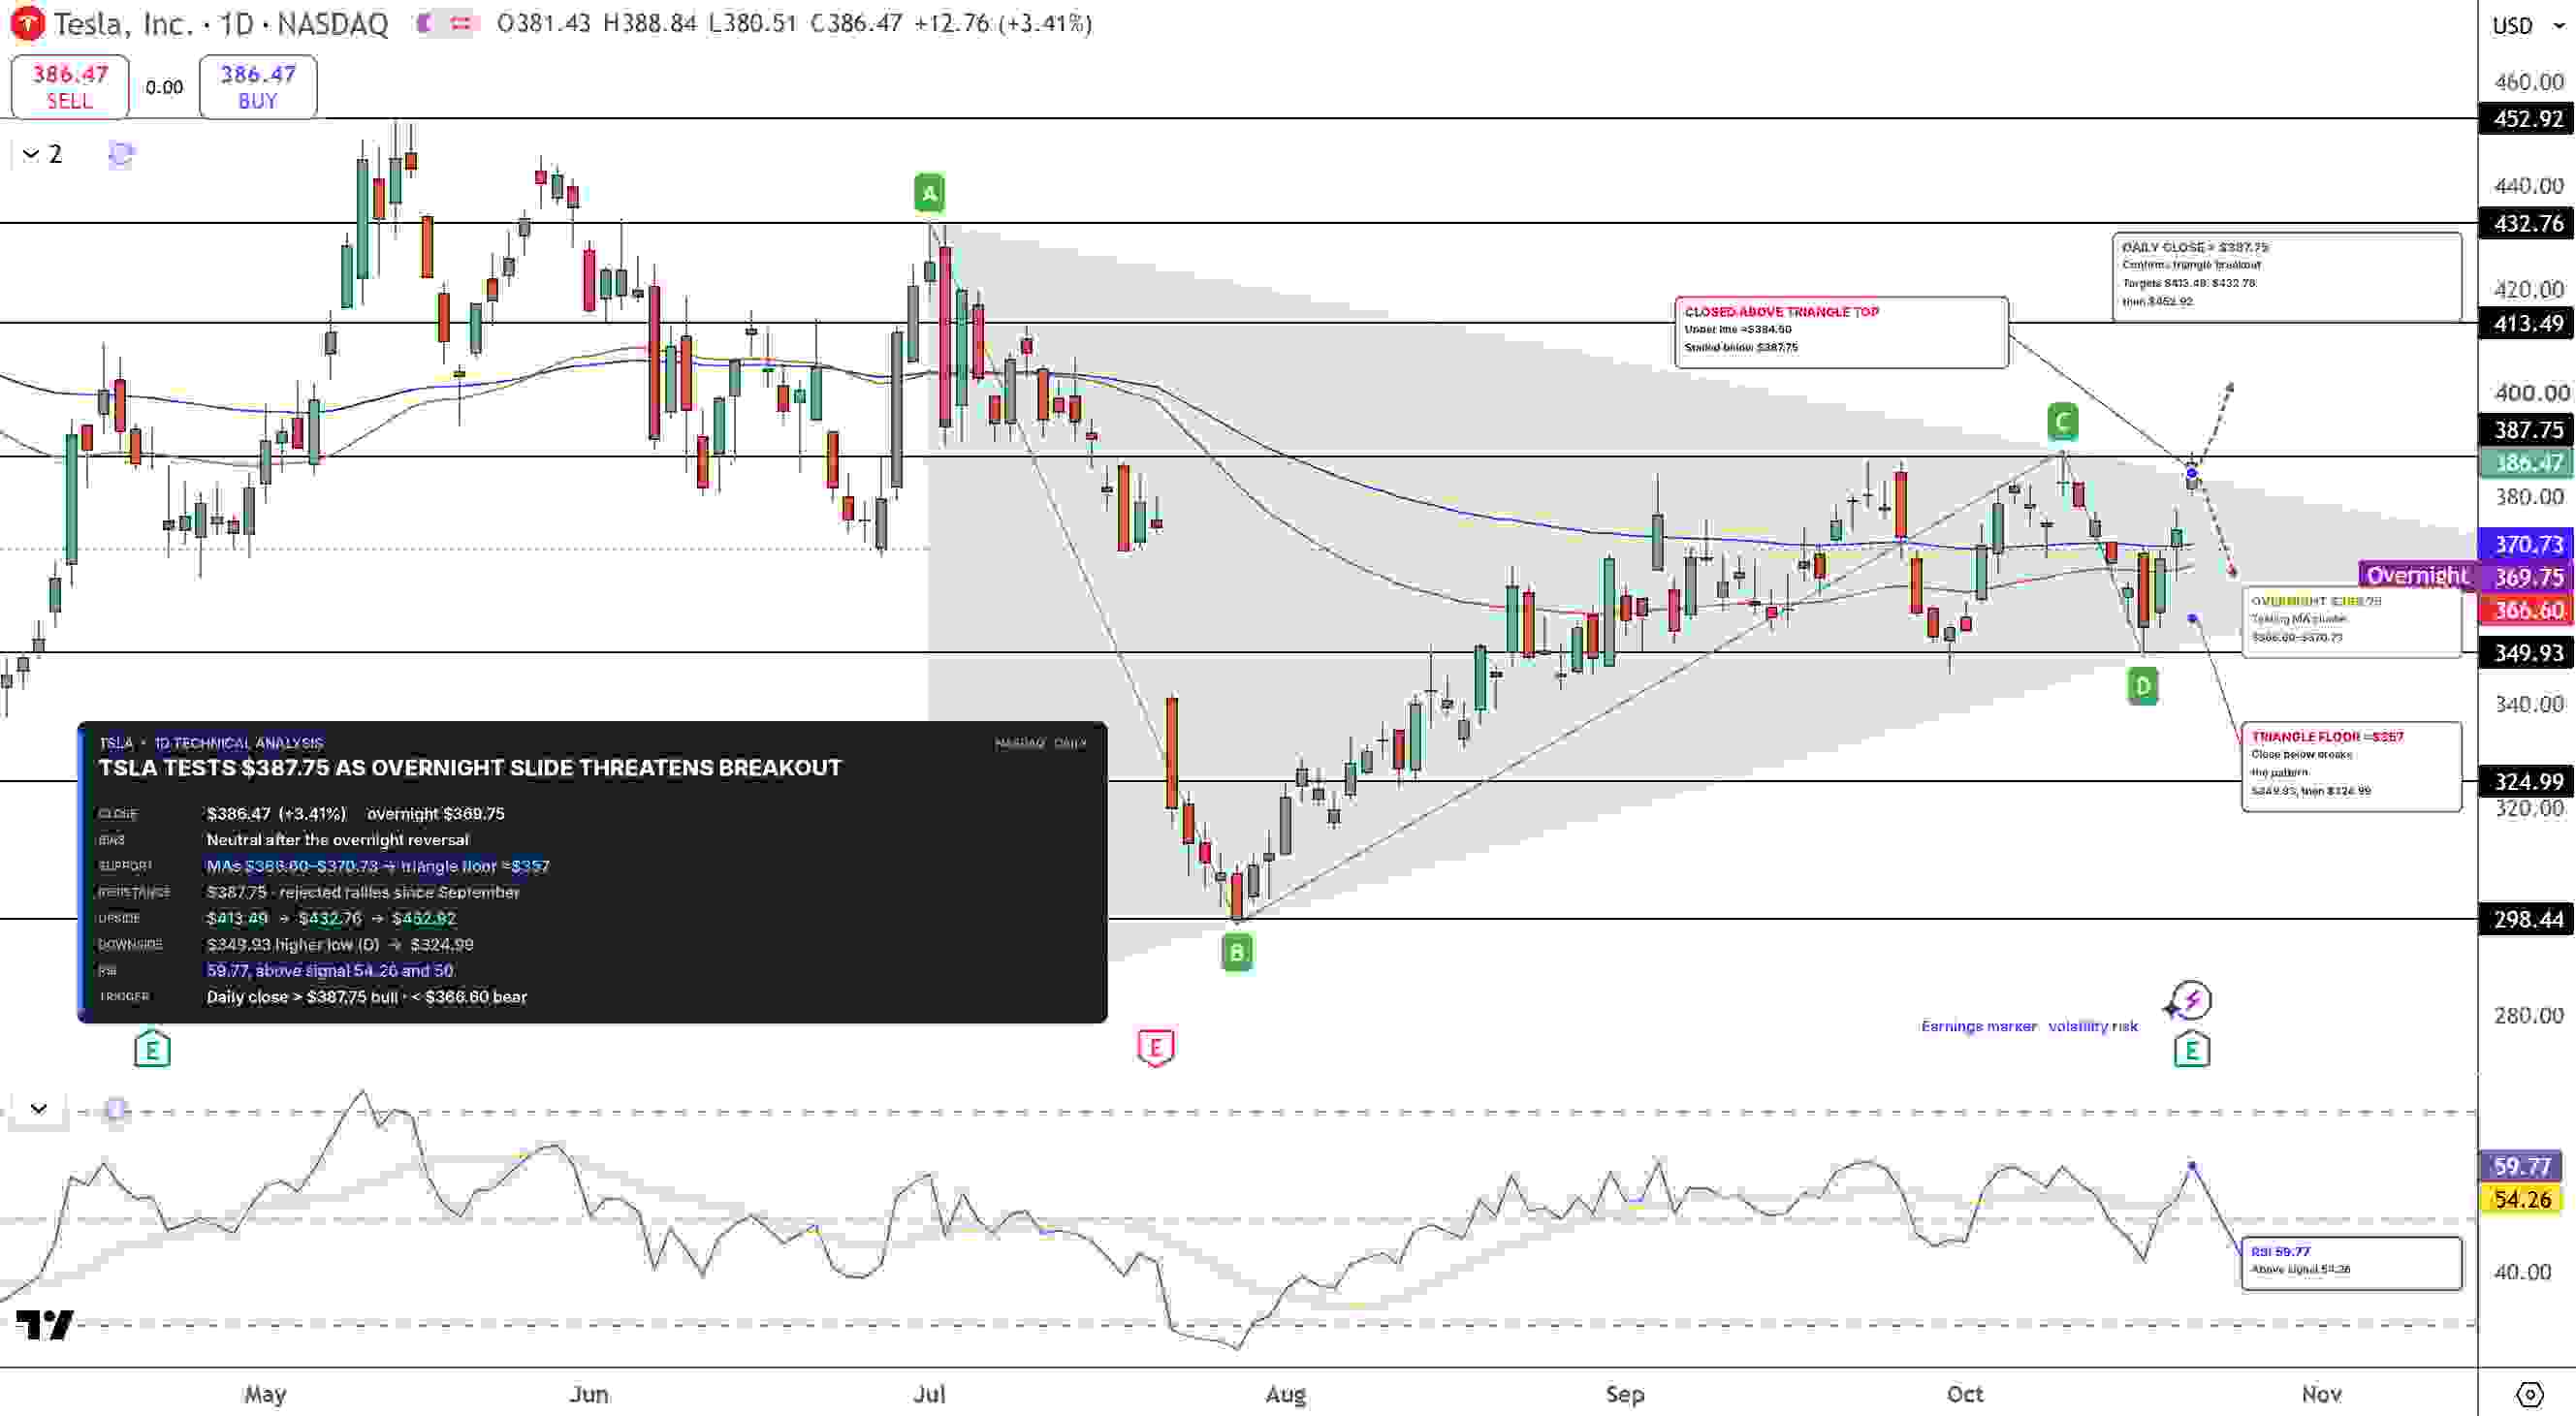
Tesla Stock Price Chart - Source: Tradingview
RSI is nearly at 60 and above the signal line, but this reading could easily fade as selling pressure enters the cash open after Wednesday's strong move higher.
A close above $387.75 would confirm the breakout of the triangle and have the price target at $413.49, and $432.76 next. If the price closes below $366.60, that would put the price in the lower-half of the triangle and the target would shift lower to $349.93. If the price breaks below that level, the pattern would be negated with the next target at $324.99.
I think the after-hours reversal keeps the bias neutral to bullish until the price breaks one of these targets.
Key Levels
Last close: $386.47, up 3.41% on October 21
Support: $370.73, $366.60, $349.93, $324.99
Resistance: $387.75, $413.49, $432.76, $452.92
RSI: 59.77, above its 54.26 signal line
Bullish trigger: Daily close above $387.75
Bearish trigger: Daily close below $366.60
FAQs
What happened to Tesla’s stock following Q3 earnings?
Although Tesla saw an early after-hours gain, investor focus on a 56% drop in operating income, robotaxi revenue pushed to 2027, and the lack of an update on the SpaceX merger contributed to the after-hours decline. The reduction in capex to approximately $20 billion was not enough to negate that.
What is the outlook on Tesla’s stock post earnings?
The bias is neutral while TSLA trades between $366.60 and $387.75. A close above $387.75, opens $413.49 and $432.76, and a close below $366.60 opens at $349.93 and $324.99.
Bottom Line
While Tesla proved it can rebuild margins and reduce costs, the 56% drop in operating income is still concerning as costs outpaced gross profit. The level to watch is $387.75, which has capped upside since September. The range between $387.75 and $366.60 is where I see TSLA trading in the near future. A close below $366.60 would flip me bearish.
Recommended Articles








Comments (0)
Click the $ button, enter the symbol, and select to link a stock, ETF, or other ticker.