


AMD Stock Price Forecast: Stock Hits Record High, Eyes Next Target of $732



AI Podcast


As of September 25 Eastern Time, AMD closed at a record high of $630.63, maintaining a market capitalization above $1 trillion. Short-to-medium-term moving averages reflect a strong bullish alignment, while the MACD confirms persistent upward momentum. However, the 14-day RSI at 73 signals an overbought condition, elevating short-term profit-taking risks. Immediate resistance stands near $640, with upside potential targeting $700–$732 if key Fibonacci extensions are breached. Initial downside support rests at $620–$623, with crucial medium-term support positioned at $584–$585.

TradingKey - As of the close on September 25 Eastern Time, AMD (AMD) stock price set another all-time high, closing at $630.63 after reaching an intraday high of $639, up 0.22% on the day. Previously, AMD surged on September 21, crossing $1 trillion in market capitalization for the first time, and its stock price has since sustained above $600.
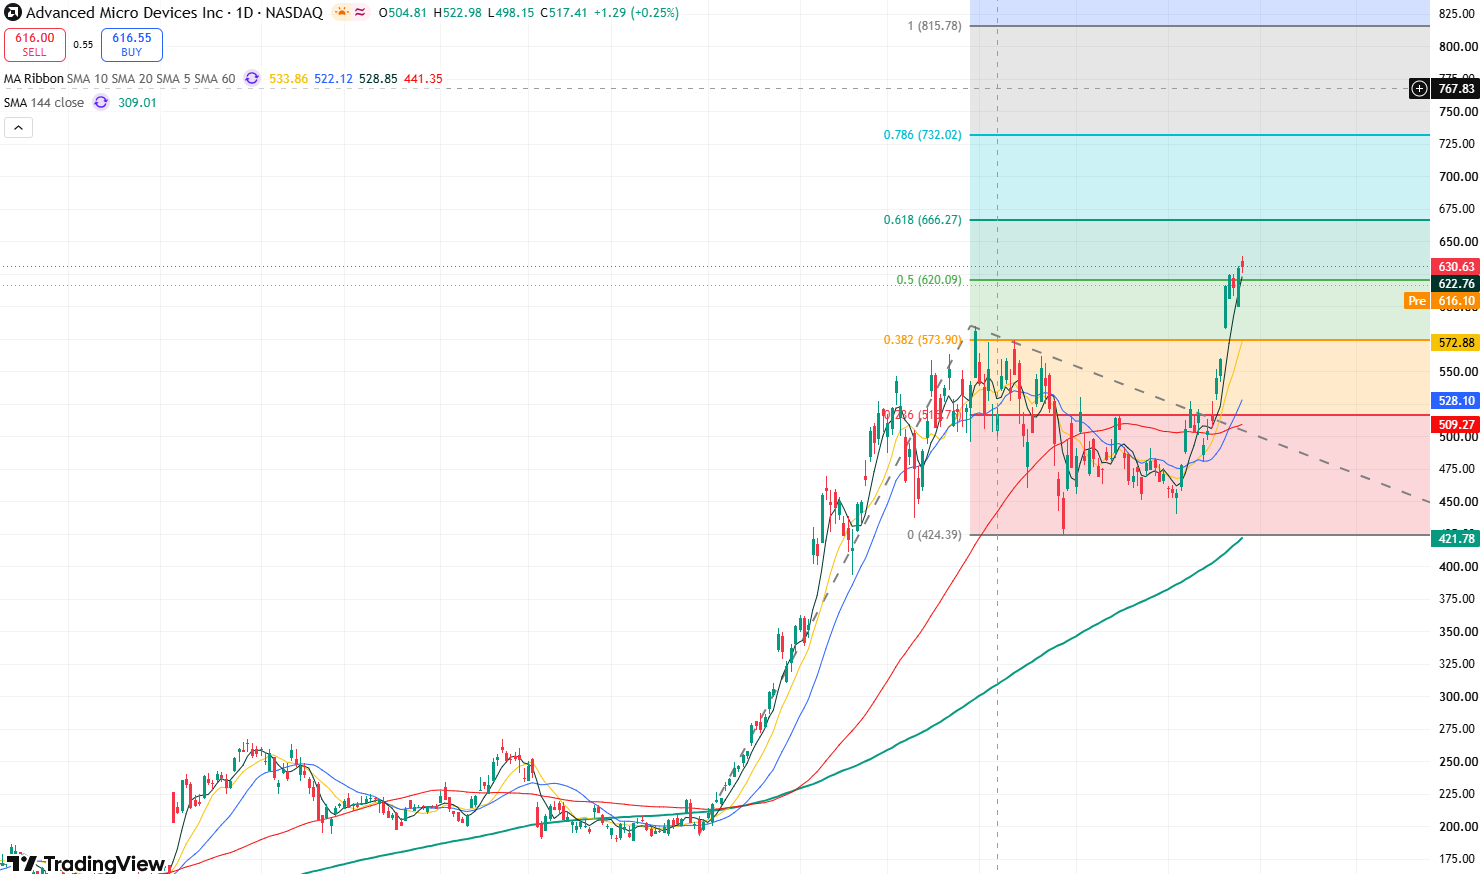
AMD daily stock price chart, Source: TradingView
From the perspective of moving averages, AMD's 5-day moving average currently stands at $622.76, the 10-day moving average at $572.88, and the 20-day moving average at $528.10. The short-to-medium-term moving averages maintain a bullish alignment, with the stock price continuing to trade well above major moving averages, indicating that the overall uptrend remains intact.
In terms of momentum indicators, the 14-day RSI stands at 73, entering overbought territory. This indicates a rapid short-term gain, increasing the risk of high-level consolidation or profit-taking. As for the MACD, the MACD line remains above the signal line, with the histogram staying in positive territory, suggesting that the current upward momentum has not significantly weakened.
In the short term, immediate resistance on the upside is near the previous high of $640. If the stock continues to set new all-time highs, it will test the 0.618 Fibonacci extension level at $666. If it can hold firmly above this level, it will open up upside room toward $700-$732.
On the downside, initial support is near $620-$623, close to the 5-day moving average. A breakdown below this level could lead to a further retest of the $600 psychological mark. Further down, more crucial medium-term support lies around the previous breakout zone of $584-$585.
This content was translated using AI and reviewed for clarity. It is for informational purposes only.
Recommended Articles











Comments (0)
Click the $ button, enter the symbol, and select to link a stock, ETF, or other ticker.