


Micron Stock Price Forecast: Can MU Retest Record Highs on AI Memory Demand Ahead of Earnings?



AI Podcast


Micron Technology will report its fourth-quarter fiscal 2026 earnings on September 30. Wall Street expectations exceed company guidance, driven by strong demand for DRAM, HBM, and data center storage. Key focus areas include fiscal 2027 guidance, gross margins, and HBM4 shipment pace. Technically, Micron's short-term trend remains bullish with a bullish moving average alignment. Primary upside resistance sits near $1,100, targeting $1,200 upon breakthrough, while key downside support rests at $1,042. Conservative guidance could prompt profit-taking following recent stock gains.

TradingKey - Micron Technology (MU) will report its fourth-quarter fiscal 2026 earnings after the U.S. market close on September 30. As of the close on September 25 Eastern Time, Micron closed at $1,082.28, up 0.16%. Since its low near $926 on September 16, the stock has rebounded by approximately 17%, and market focus has shifted to the upcoming earnings results and guidance for the next fiscal year.
Market Expectations Continue to Be Revised Upward, Next-Quarter Guidance Is More Important
From the perspective of market expectations, Micron previously provided Q4 guidance of revenue at $50 billion ± $1 billion, a non-GAAP gross margin of around 86%, and adjusted EPS of $31 ± $1. Wall Street expectations are currently slightly above company guidance, with market consensus projecting revenue of around $50.8 billion to $51.2 billion and adjusted EPS of around $31.4 to $31.6, implying that investors have already priced in a certain level of outperformance in advance.
The core driver behind rising expectations remains demand for DRAM, HBM, and data center storage. Stifel projects Q4 revenue of around $50.78 billion and notes that DRAM shipment growth may slow to 15%–20% in 2027, primarily due to supply bottlenecks rather than declining demand. If supply continues to lag behind AI server demand, DRAM prices and Micron's profit margins could remain elevated. Meanwhile, TD Cowen expects Micron's gross margin could reach around 89% by mid-2027.
Therefore, for this earnings report, key factors to watch include Q1 FY2027 revenue and gross margin guidance, as well as DRAM/NAND price trends and the pace of HBM4 shipments. Micron previously confirmed that HBM4 has entered high-volume shipping, though more customers remain in the qualification phase. If guidance for the next quarter continues to top market expectations, earnings forecasts still have room for further upward revisions; conversely, following the stock's substantial gain this year, conservative guidance could trigger profit-taking even if Q4 numbers are strong.
Micron Stock Price Technical Analysis
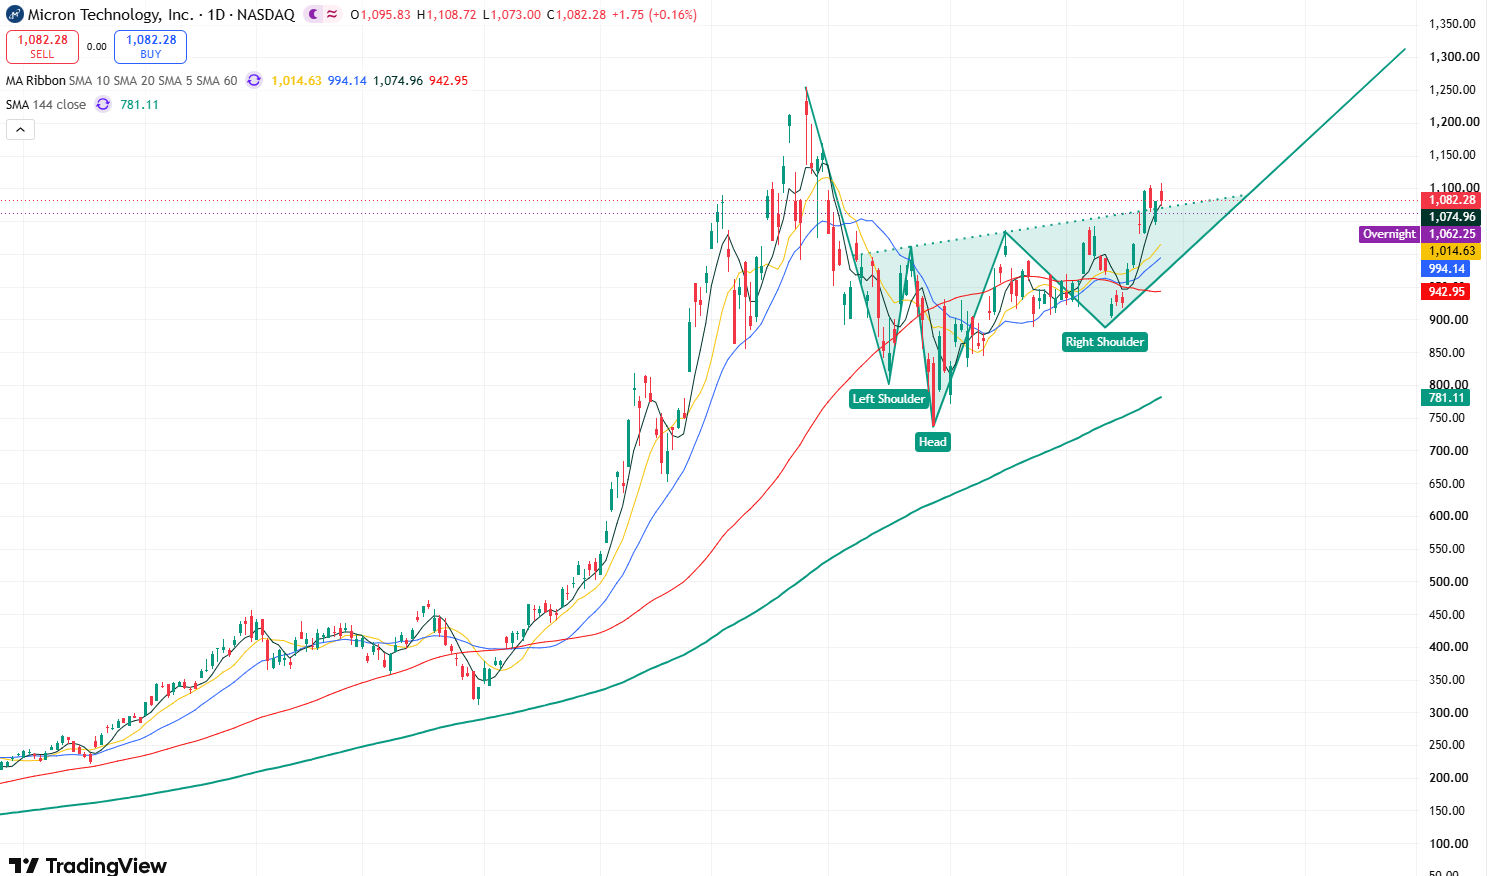
Micron stock price daily chart, Source: TradingView
Looking at the daily chart of Micron's stock price, as the stock broke through the September 9 high of $1,042, further upside room has opened up. Currently, the stock price is consolidating near the $1,100 mark; however, it continues to trade above the 5-day moving average, and the 5-day, 10-day, and 20-day moving averages display a bullish alignment, indicating that the short-term trend remains bullish.
Currently, the head-and-shoulders bottom pattern formed by the overall candlestick structure continues to play out, with bullish market sentiment clearly holding the upper hand. On the upside, the primary support level to watch is $1,100. If the stock price holds firmly above this level, it will open up upside space toward the $1,200 mark, and could even further test the previous record high of $1,255.
On the downside, the primary support level below to watch is $1,042. If this level is breached, the stock price may test the $1,000 mark on the downside, and further down, it could potentially test the $900 support level.
This content was translated using AI and reviewed for clarity. It is for informational purposes only.
Recommended Articles











Comments (0)
Click the $ button, enter the symbol, and select to link a stock, ETF, or other ticker.