


Lululemon Stock Price Forecast: Disappointing Earnings Send Stock Tumbling 18%, Can LULU Rebound?



AI Podcast


Lululemon reported disappointing fiscal Q2 2026 results, with revenue falling 4% year-over-year to $2.416 billion and comparable sales dropping 9%, driven by slumping North American demand and weakening core product appeal. Profitability was temporarily supported by a tariff refund. The company issued a severe downward revision to its full-year guidance, projecting ongoing sales declines. Consequently, shares plunged over 18% in after-hours trading to below $100, invalidating previous technical recovery signals. Incoming CEO Heidi O’Neill faces intense pressure to address market share erosion, product missteps, and structural declines as the brand contends with rising competition.
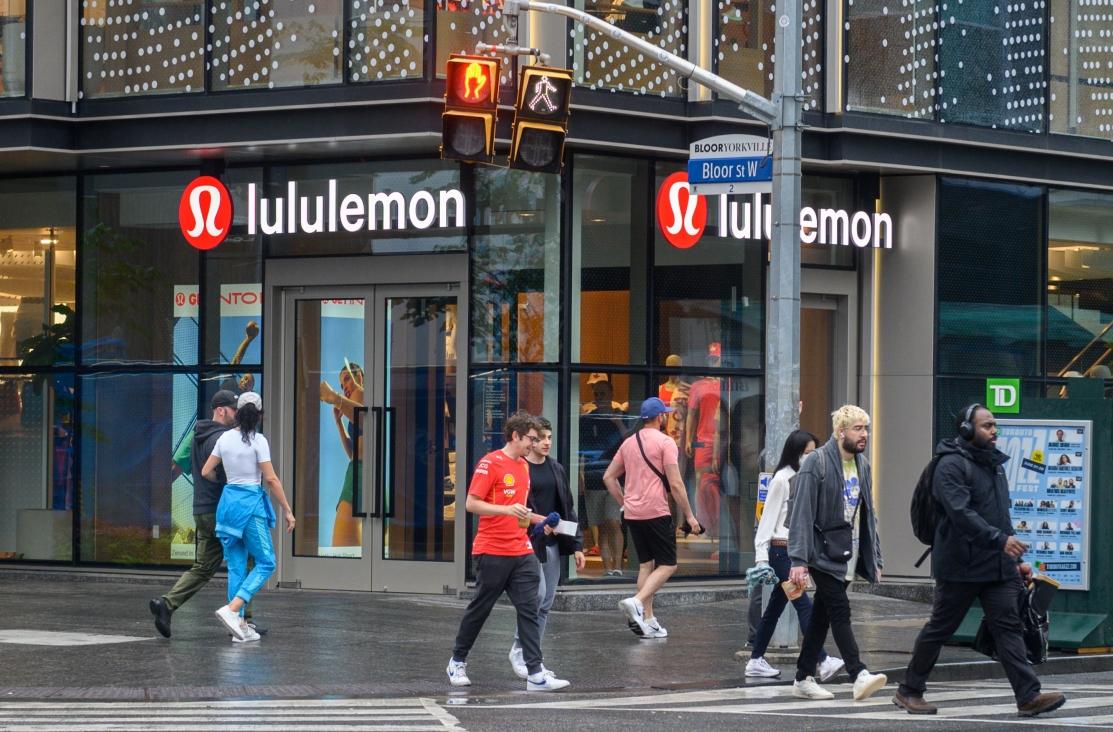
TradingKey - Lululemon (LULU) delivered another disappointing earnings report.
Impacted by a continued slump in North American sales, sluggish demand for core products, and another downgrade to its full-year guidance, the company's stock fell over 18% in after-hours trading following the earnings release, dropping below $100. Prior to the release, LULU shares had already fallen over 40% year-to-date, down more than three-quarters from their record high at the end of 2023.
In the second quarter of fiscal 2026, Lululemon's revenue fell 4% year-over-year to $2.416 billion, missing Wall Street expectations of $2.46 billion; on a constant currency basis, revenue declined 5%. Comparable sales fell 9%, also significantly weaker than the market expectation of a 4.6% decline. Net profit fell from $371 million in the same period last year to $329 million, while earnings per share dropped from $3.10 to $2.92.
North American Sales Worsen as Core Product Appeal Declines
Lululemon's greatest pressure currently still stems from the Americas market. In the second quarter, revenue in the Americas region fell 8%, with comparable sales dropping 12%; while international market revenue grew 4%, comparable sales also fell 3%, or 6% on a constant currency basis. This indicates that sluggish demand is no longer confined to a single region.
Meghan Frank, interim co-chief executive officer and chief financial officer, stated that negative commentary on social media weighed on brand performance, but product issues may be a deeper root cause. Market reception for some of the company's new products was uneven, with sales declines in core categories such as leggings and women's tops exceeding expectations, including a reported drop of around 20% in yoga pants sales.
In the past, Lululemon built its competitive advantage by relying on functional fabrics, classic leggings, and a strong brand premium, but now faces continuous competition for consumers from emerging brands like Alo and Vuori. In recent years, the company expanded into fashion items and collaborative products, but some new products failed to generate stable demand, instead eroding the brand recognition of its core products.
Meanwhile, Lululemon's second-quarter gross profit fell 1% to $1.462 billion, yet its gross margin rose 200 basis points to 60.5%. On the surface, the company's profitability appears to have improved, but this change was driven primarily by a $134.5 million tariff refund.
This refund boosted gross margin and operating margin for the quarter by 560 basis points each, and along with $4.1 million in related interest, contributed $0.86 to earnings per share. Excluding one-time gains, Lululemon's actual profit performance would be significantly weaker than the stated figures.
Full-Year Guidance Cut Again as New CEO Takes Over Transformation
Lululemon expects third-quarter revenue of $2.29 billion to $2.32 billion, down 10% to 11% year-over-year, significantly below analysts' previous estimate of approximately $2.53 billion; earnings per share are projected at just $0.93 to $0.98.
The company also lowered its fiscal 2026 revenue guidance from $11 billion–$11.15 billion to $10.35 billion–$10.5 billion, representing a year-over-year decline of 5% to 7%. Full-year earnings per share guidance was also reduced from $10.95–$11.15 to $9.48–$9.73, with the new guidance already incorporating a $0.86 contribution from second-quarter tariff refunds. This indicates that excluding one-time gains, Lululemon's actual operational pressure is even more pronounced.
This marks the second consecutive quarter the company has lowered its full-year guidance, indicating that previous adjustment efforts have yet to yield significant results. Although management emphasized plans to introduce new styles, increase marketing spending, and improve full-price sales in the second half of the year, third-quarter guidance shows that the sales decline could continue to accelerate.
Incoming Chief Executive Officer Heidi O’Neill will officially take office next week. As a former Nike executive, she needs to simultaneously address declining North American demand, loss of appeal in core products, market share erosion, and management restructuring. Investors hope O’Neill will curb inefficient store expansion and refocus resources on product R&D, classic categories, and brand marketing.
Lululemon Stock Price Technical Analysis
Source: TradingView
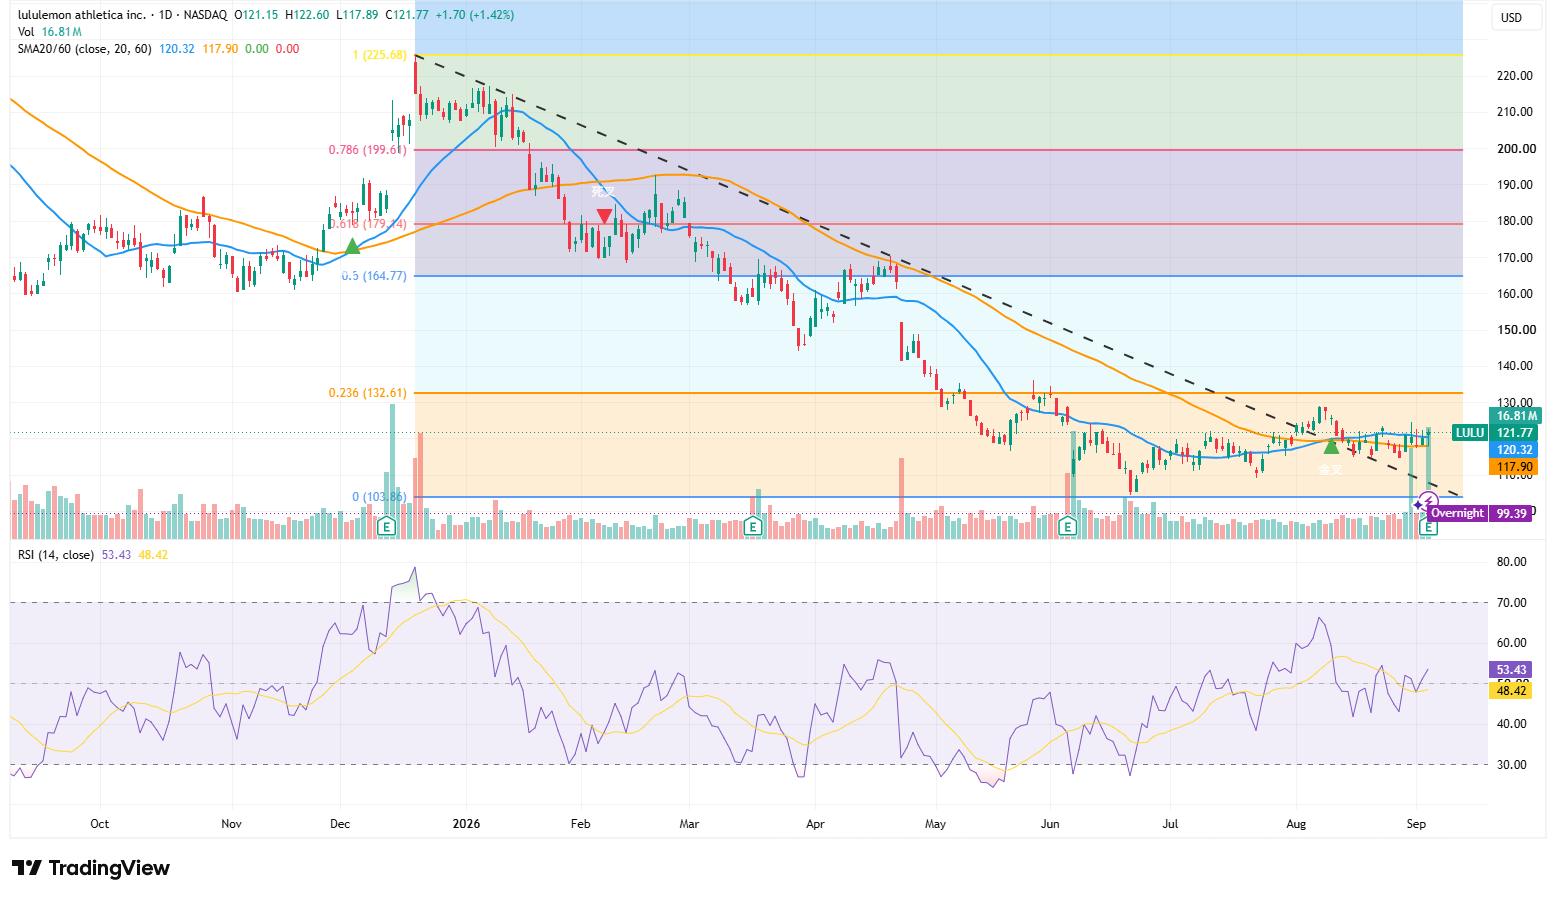
Prior to the earnings release, LULU closed at $121.77, slightly above its 20-day moving average of $120.32 and 60-day moving average of $117.90. The RSI stood at 53.43, also reclaiming 50, which initially indicated that the stock was attempting to form a short-term bottom.
However, the price dropped to $99.39 in after-hours trading, not only falling back below both moving averages but also breaking below the previous low of $103.86 shown in the chart, essentially invalidating the strengthening signal formed ahead of the earnings report.
On the downside, initial focus should be on the psychological level of $99 to $100. If LULU breaks below $100 on heavy volume during regular trading hours and consistently closes below $103.86, it would mark a new low in the long-term downtrend, potentially seeking support in the $90 to $95 range going forward. Conversely, if the stock quickly reclaims $103.86 to $105, it could constitute a short-term false breakdown and trigger an oversold bounce.
On the upside, the first resistance level is at $117.90 to $120.32, where the 60-day and 20-day moving averages converge. Only a move back above this zone would indicate that post-earnings selling pressure is beginning to ease. A more critical resistance level sits at $132.61, which corresponds to the 0.236 Fibonacci level; if the stock can break above $132.61 and the downtrend line on heavy volume, the medium-term trend may shift from a bounce to a true reversal.
This content was translated using AI and reviewed for clarity. It is for informational purposes only.
Recommended Articles











Comments (0)
Click the $ button, enter the symbol, and select to link a stock, ETF, or other ticker.