


IBM Stock Forecast: Q3 Software Rebound Can't Hold the Breakout as Shares Fall Back Toward $238.20



AI Podcast


International Business Machines reported a third-quarter beat on revenue and operating EPS, driven by recovering delayed software deals and 9% software growth. Despite higher free cash flow and strong Red Hat performance, shares fell after-hours due to narrowed gross margins and an unchanged 2026 revenue guidance. Technically, the stock faces a potential bull trap, with immediate downside pressure unless it closes above the $241.57 resistance level, while a break below $238.20 targets further support near $233.19.
TradingKey - International Business Machines (NYSE: IBM) ended the day on October 21 at $251.46, up 3.94% from the previous day. After its third-quarter report, the shares rose around 6% to approximately $267, then fell to $242.25 after hours (down 3.66%). Premarket quotes at about $236.88 this morning would erase the regular session's gains.
There was a beat on both the revenue and EPS lines. IBM also said the deal delays it cited in July were simply timing, not lost demand. Free cash flow was also reported to be higher, but the revenue guidance, which was cited by many to be the catalyst for the rally, was left unchanged.
Q3 Beat on Revenue and EPS
Revenue for the quarter was $17.10 billion, up 5% from the same quarter last year, or 6% at constant currency. Analysts were expecting revenue of $16.82 billion. Operating EPS was $2.95, above the $2.86 estimate, up from the same quarter last year of $2.65. Operating pre-tax margins were 19.3%, up 0.7% from the same quarter last year.
The Delayed Deals Came Back
In July, IBM said weak results were attributed to deals slipping out of the quarter. CFO Jim Kavanaugh said about two-thirds of the large software deals that slipped from Q2 have now closed. Kavanaugh said that about a quarter of software's acceleration was attributed to those deals and that about three-quarters of the acceleration was due to new business.
TP, the mainframe software business, reported constant currency growth of 10% in Q3 after declining by 9% in Q2. IBM CEO Arvind Krishna said that he does not expect the double-digit growth in the business to continue and that they now expect the business to be flat for the year.
Software Accelerates to 9% Growth
Software, at constant currency, increased by 9% to $7.80 billion, an acceleration by 4 points from Q2. IBM said Red Hat grew 11%, with bookings growth now in the high teens, and OpenShift is now a $2.4 billion annual recurring revenue business and is growing by over 30%. IBM said data revenue grew by 20% in the quarter while Automation revenue fell by 3%. Annual recurring revenue from software grew by 8% to $24.9 billion.
Infrastructure and Consulting
Revenue from Infrastructure was up 5% at constant currency to $3.71 billion. Distributed Infrastructure grew 32%, while IBM Z declined 20%, better than the 42% decline in Q2. Consulting revenue increased 2% at constant currency to $5.34 billion, and AI now accounts for about 30% of consulting revenue and 35% of its backlog.
Unchanged Revenue Guidance and Thinner Gross Margins
IBM said its 2026 revenue growth outlook of 4% to 5% at constant currency remains the same, with its profit and cash plans anchored to the 4% base case. It increased its outlook for free cash flow growth to more than $1 billion, up from about $1 billion, and expects software revenue growth of about 7% to 8%. Krishna said he is comfortable with double-digit growth at Red Hat in Q4, but would not comment on 2027.
With no changes to the revenue range following a beat, there is less room for Q4, and part of Q3's software strength came from recovered deals that will not repeat. Gross margins also narrowed, with software at 82.5% from 83.1% and consulting at 27.4% from 29.3%. The higher cash flow outlook did not stop the after-hours share decline.
Strong Cash Flow
Free cash flow for Q3 increased to $3.03 billion from $2.37 billion, bringing the nine-month total to $7.79 billion. During the quarter, IBM spent $1.6 billion on dividends and ended the quarter with cash, restricted cash and marketable securities of $11.1 billion.
IBM Potential Technical Analysis: Daily Close Below $238.20 Targeting $233.19
On the daily chart, IBM broke above the $238.20 to $241.57 resistance area on Wednesday, which has capped the upside since August, and posted its highest close since early September. The pre-market quote around $236.88 would put the price back below the resistance area and the moving average at $238.20. A break above a resistance area and subsequent close below it is known as a “bull trap.” In this case, the moving average sits at $233.19.
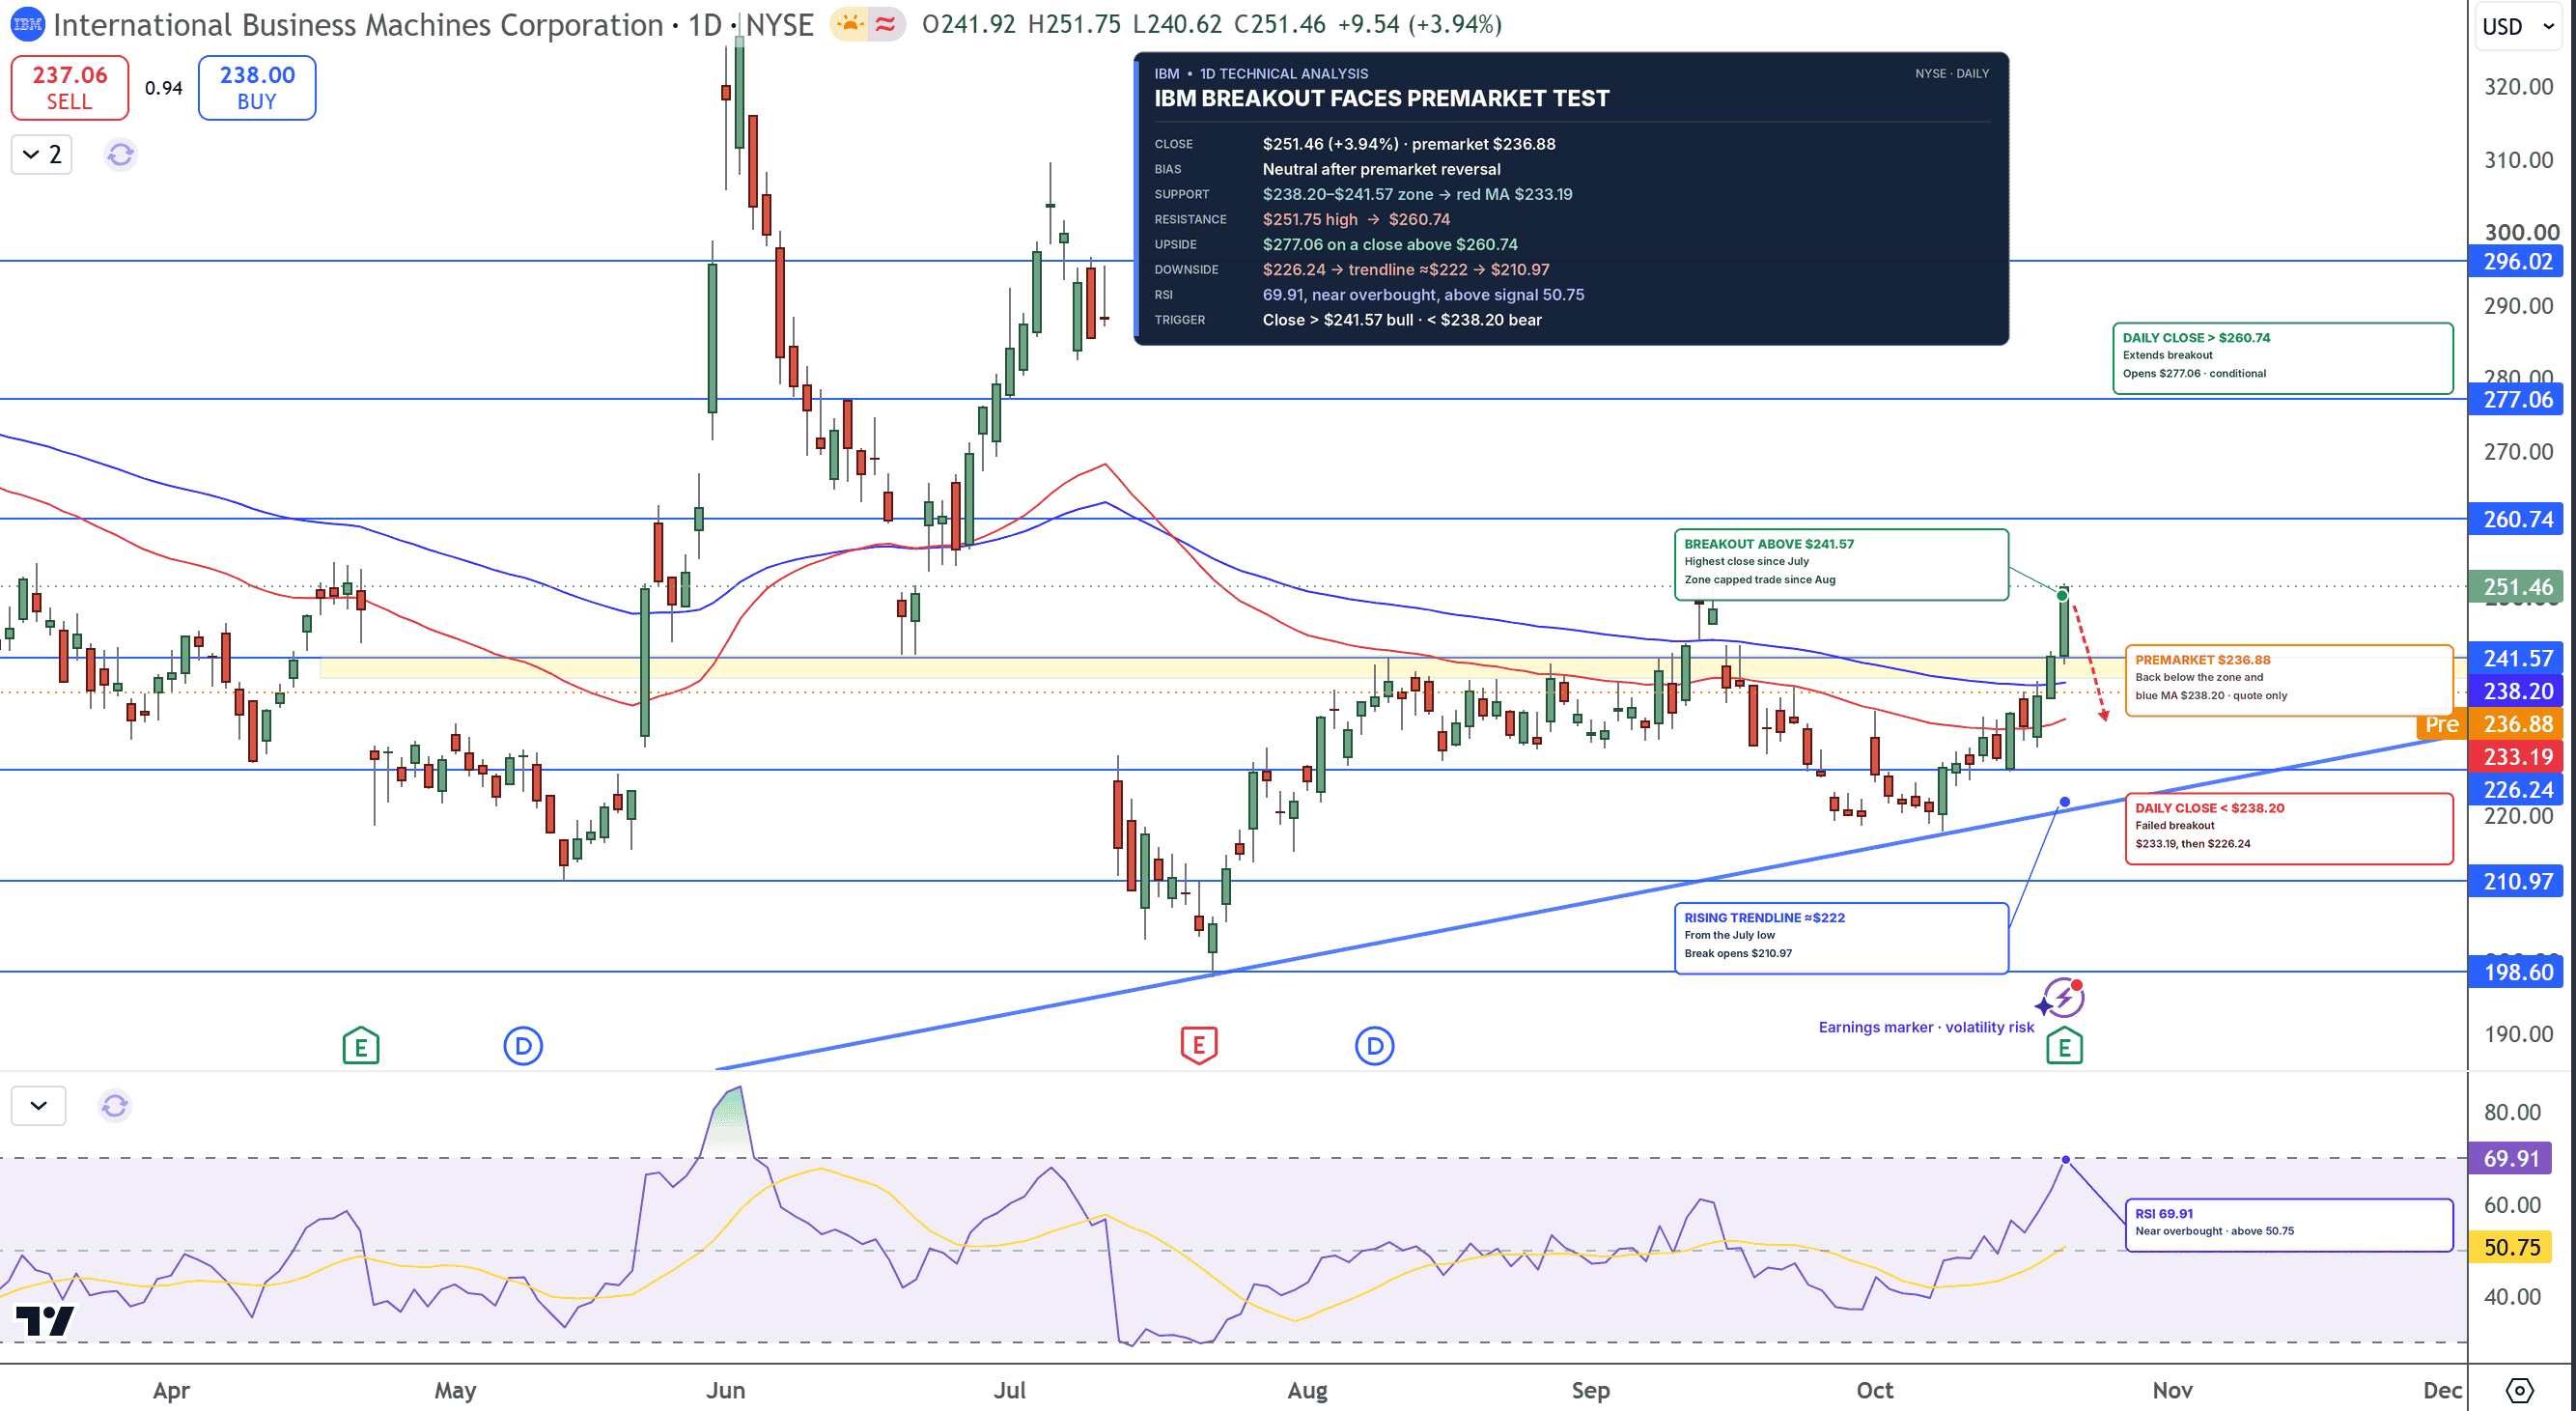
IBM Stock Price Chart - Source: Tradingview
Relative Strength Index (RSI) ended the day at around 70, above its signal line, so momentum was stretched before the reversal and could fast-cool if the selling carries into the open.
If the selling pressure continues and price closes below the $238.20 area, the move would confirm the breakdown, opening the way to $233.19 and $226.24. A breakdown below the uptrend line from the July lows would open the area around $210.97. Until IBM closes above the $241.57 area, in my opinion, bears are in control.
Key Levels
Last Close: $251.46, up 3.94% on October 21
Support: $241.57, $238.20, $233.19, $226.24, $210.97
Resistance: $251.75, $260.74, $277.06
RSI: 69.91, above its signal line at 50.75
Bullish Target: Daily close above $241.57
Bearish Target: Daily close below $238.20
FAQs
Why is IBM stock falling after Q3 earnings?
IBM won the quarter as expected and mostly recovered its software deals. Still, it held its 2026 revenue growth view at 4-5% and its gross margins narrowed. The shares surged 6% after the bell, and then fell 3.66%
What is the IBM stock forecast after earnings?
The bias is neutral while the stock trades around the $238.20 to $241.57 zone. A close above $241.57 brings $251.75 and $260.74 into range, and a close below $238.20 opens $233.19 and $226.24.
Bottom Line
With July's demand question answered, IBM's software growth was back at 9% and Transaction Processing was once again positive. However, the unchanged revenue outlook limits what the market is willing to pay. The focus level is at $238.20. Pressure will continue to be the case for IBM while it trades below that level. Only a close above $241.57 brings the bull case back into play.
Recommended Articles









Comments (0)
Click the $ button, enter the symbol, and select to link a stock, ETF, or other ticker.