


Gold Drop Widens to 2% as $4,000 Level Under Threat, Risking Further Drop of Over 12%



AI Podcast


On October 22, spot gold prices dropped 2% toward the $4,000 per ounce mark, driven by rising U.S. Treasury yields, a stronger U.S. Dollar Index, hawkish Federal Reserve remarks, and a waning geopolitical risk premium. This surge in real yields increased the opportunity cost of holding gold, triggering quantitative profit-taking and safe-haven capital outflows. A failed retest risks a further collapse toward the $3,500–$3,550 range. Conversely, stabilization in the $3,900–$3,980 range could prompt a recovery toward the $4,300 all-time high if inflation cools or geopolitical demand resurges.
TradingKey - Gold bulls suffer a bloodbath as prices fall 2% toward the $4,000 abyss; a failed retest risks a collapse toward $3,500.
On October 22, spot gold prices (XAUUSD) extended losses to 2%, approaching the $4,000 mark and dropping to a low of $4,059 per ounce. In the first half of this year, gold prices plummeted to the $4,000 level before steadily rebounding to hit a high of $4,700 in late August. Now, a second test of this level is raising market concerns.
Over the past three months, the sharp drop in gold prices following a strong rally was primarily driven by jumping U.S. Treasury yields and a powerful short squeeze in the U.S. Dollar Index (DXY). Hawkish remarks from Federal Reserve (Fed) officials, coupled with higher-than-expected inflation data, significantly dampened market bets on aggressive rate cuts within the year. Furthermore, the rapid rebound in 10-year U.S. real yields substantially increased the opportunity cost of holding gold, prompting massive quantitative funds to engage in defensive profit-taking.
Another non-negligible factor is the temporary waning of the geopolitical risk premium. Recently, the situations in the Middle East and Russia-Ukraine entered a phase of diplomatic mediation and standoff consolidation, leading to a marginal decrease in extreme panic. Consequently, some short-term safe-haven capital flowed out of the gold market into high-yielding U.S. dollar cash and short-term debt instruments.
Based on the current price of around $4,000, if gold prices encounter an extreme systemic liquidity crisis—such as a market-wide deleveraging sell-off—a 12% slide would see prices retreat to the $3,500–$3,550 range, where the 200-day moving average coincides with the swing low formed by central bank position-building in the first half of the year.
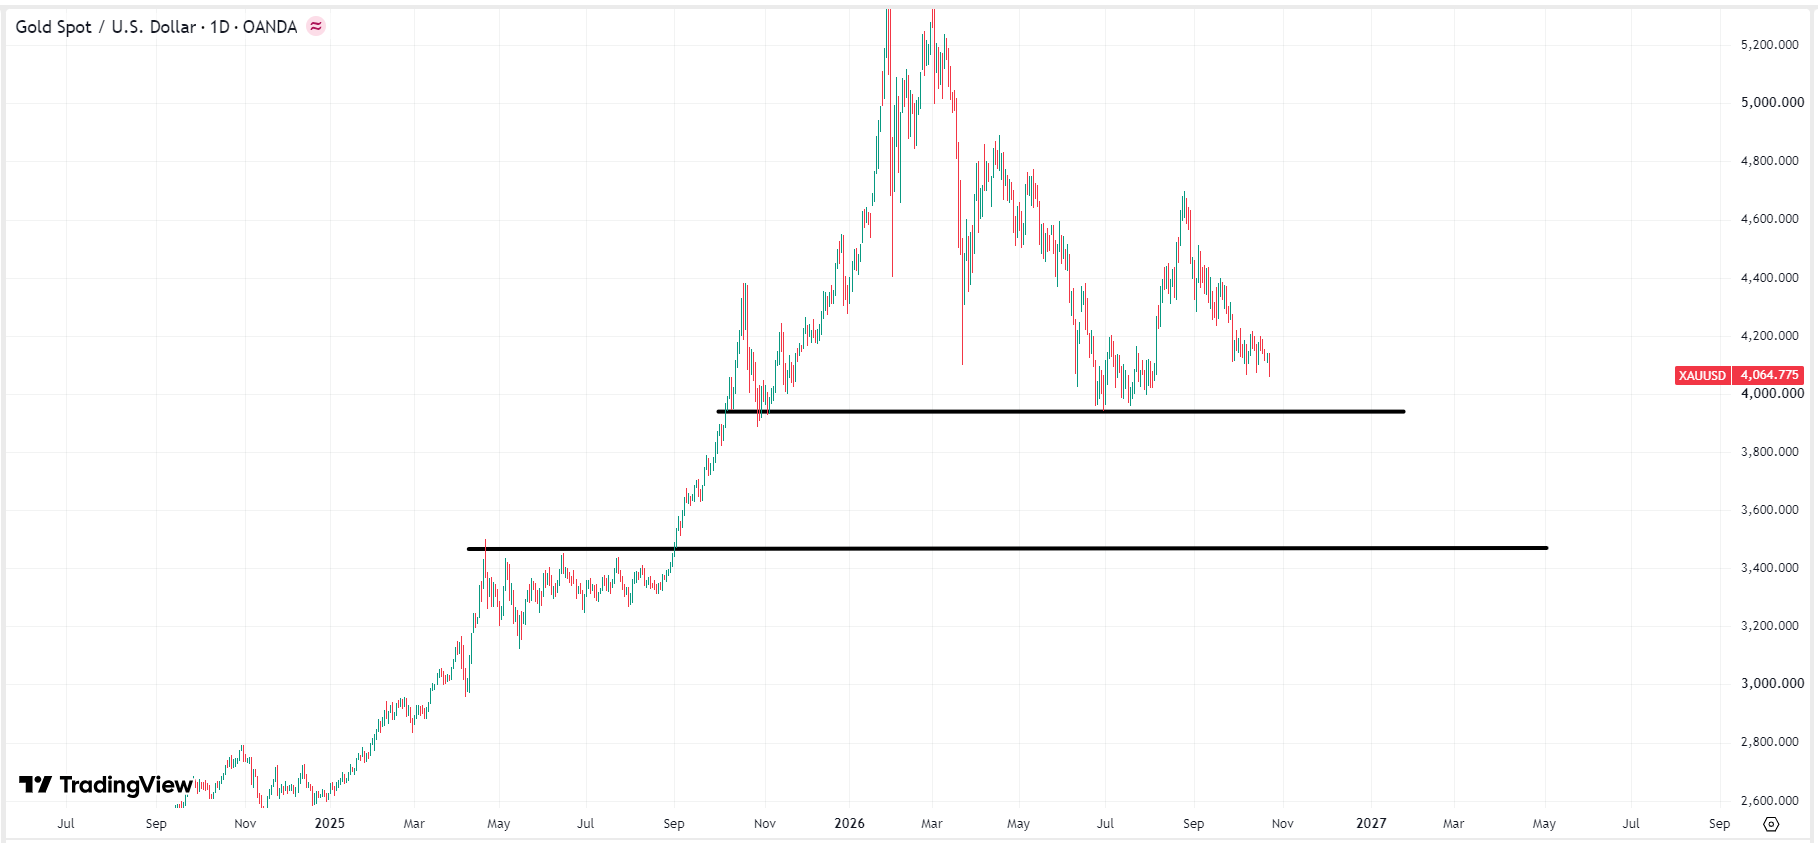 Gold price chart, Source: TradingView
Conversely, if gold prices find support and stabilize in the $3,900–$3,980 range, combined with a subsequent cooling in inflation data or a resurgence in geopolitical safe-haven demand, prices will promptly initiate a high-volume rally, reclaiming the $4,120–$4,180 resistance zone and making another attempt to challenge the all-time high of $4,300.
This content was translated using AI and reviewed for clarity. It is for informational purposes only.
Recommended Articles












Comments (0)
Click the $ button, enter the symbol, and select to link a stock, ETF, or other ticker.