


Nvidia Stock Price Forecast: Ahead of Q2 Earnings, Can It Push Stock to a Record High?



AI Podcast


As of August 25 ET, Nvidia rose 2.19% to $213.05 ahead of its Q2 fiscal 2027 earnings release. The upcoming report is a critical catalyst for short-term price direction, with markets focusing on four key areas: data center revenue growth, the Vera Rubin platform shipment timeline, Q3 revenue guidance, and adjusted gross margins remaining near 75%. While options imply a 5.4% post-earnings swing, historical trends suggest a simple guidance beat may be insufficient for record highs. Technically, the stock found support at the 60-day moving average, with downside risk toward $200 and resistance near $230.
TradingKey - As of August 25 ET, Nvidia (NVDA) rose 2.19% to $213.05, ending a seven-consecutive-session losing streak. Nvidia will release its second-quarter fiscal 2027 financial report after the market close on August 26. Amid heightened recent volatility in the AI sector, this earnings report will serve as an important catalyst influencing the short-term direction of Nvidia's stock price.
Nvidia Q2 Earnings Report Upcoming: What to Watch
First is the data center business. The market expects Nvidia's second-quarter total revenue to be approximately $92.18 billion, with data center revenue at about $85.67 billion, up roughly 108% year-over-year. In the previous quarter, data center revenue reached $75.2 billion, up 92% year-over-year. If data center revenue continues to beat market expectations this time, it will indicate that major tech companies' AI capital expenditures are still translating into orders for Nvidia, helping to ease recent market concerns over a slowdown in AI investment growth; if it falls below expectations, it could further weigh on Nvidia's stock price.
Second is the next-generation Vera Rubin platform. As Blackwell enters the mass shipment phase, the market has begun to focus on whether Rubin can smoothly take over the baton. According to Reuters, Rubin is expected to start shipping this autumn, and Morgan Stanley estimates that Rubin could contribute nearly $9 billion in revenue in the third quarter; Oppenheimer also believes VR200 will start ramping up volume in the current quarter. For Nvidia's stock price, mass production of Rubin as scheduled means Nvidia's next product cycle is beginning to deliver, helping to raise market expectations for revenue growth in 2027; if shipment timing or capacity ramp-up falls short of expectations, it could weaken this growth outlook.
Third is the third-quarter revenue guidance. The market currently expects Nvidia's third-quarter revenue to be around $104.2 billion, up 82.8% year-over-year, while UBS estimates that actual revenue could exceed $110 billion. As the market already generally expects second-quarter performance to maintain rapid growth, the third-quarter guidance may be more important to the stock price than the already realized second-quarter figures. If management provides revenue guidance significantly exceeding $104.2 billion, it will help Wall Street continue revising earnings forecasts upward; if it merely meets or falls below this level, the market may consider that current high-growth expectations are already fully priced into the valuation.
Finally, there is the gross margin. The market expects Nvidia's adjusted gross margin for the second and third quarters to remain at around 75%. Recent price increases in memory chips such as HBM have pushed up AI server costs, making the market pay closer attention to whether Nvidia can maintain its high profit margins. If the gross margin stabilizes around 75%, it will demonstrate that the company still possesses strong pricing power and cost control capabilities; if it falls significantly short of expectations, it could impact market judgment regarding future EPS growth.
Notably, the options market currently expects Nvidia's stock price to swing by about 5.4% in either direction following the earnings report, corresponding to a market value shift of approximately $280 billion. J.P. Morgan also pointed out that over the past four quarters, Nvidia's revenue guidance exceeded market expectations by an average of about 4%, yet its stock price dropped by an average of 3% to 5% from one week to one month after the earnings release. This implies that merely having 'revenue guidance beat expectations' this time may still be insufficient to drive the stock price above its all-time high; beating expectations across all four above-mentioned areas may be required to push the stock to a new record high.
Nvidia Stock Price Technical Analysis
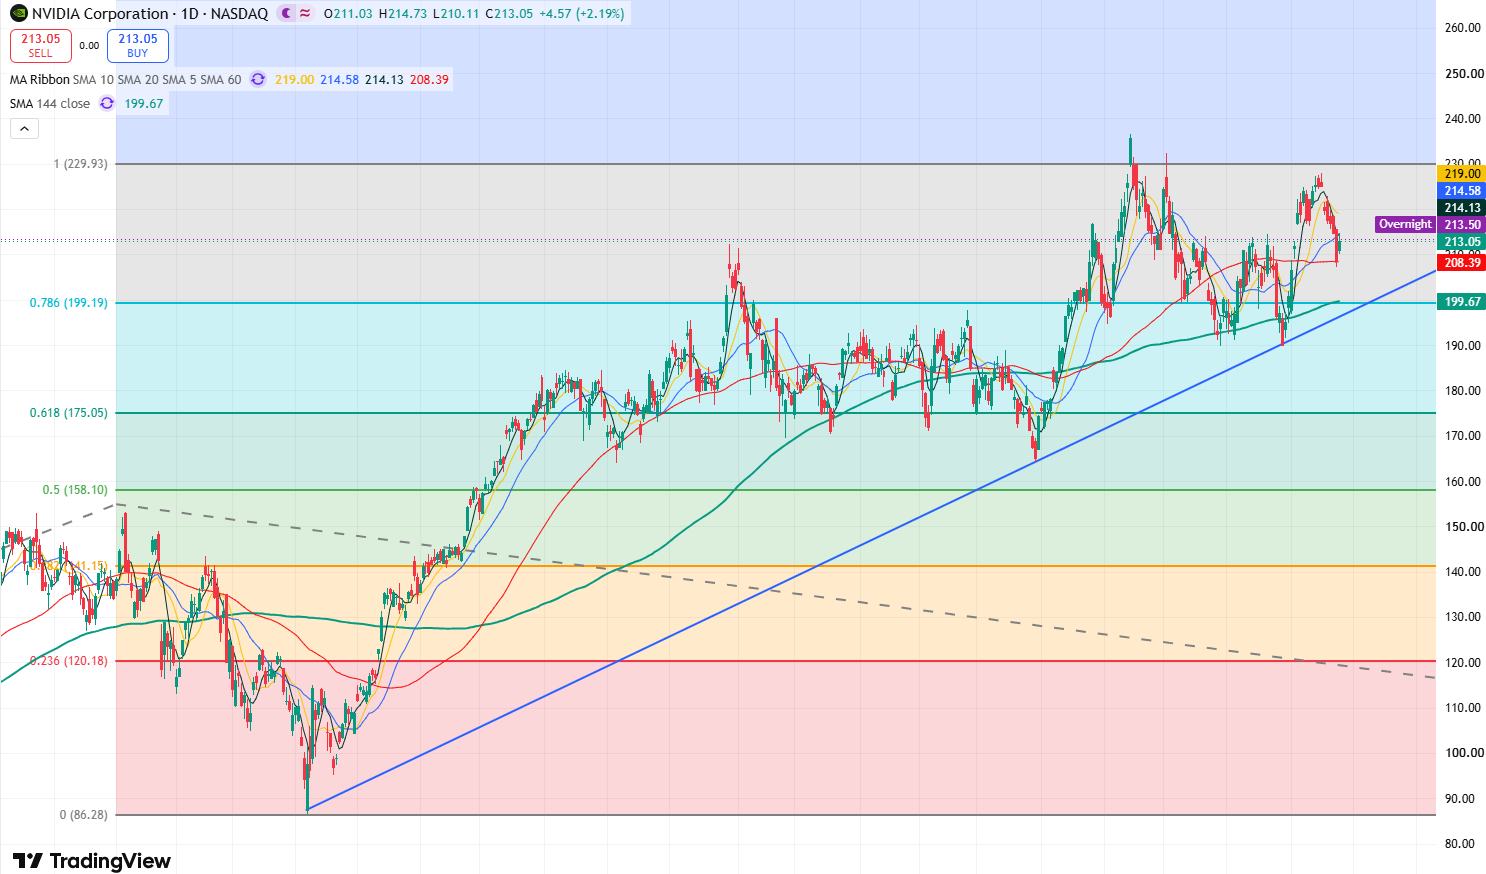
Nvidia daily stock price chart, Source: TradingView
From the daily chart of Nvidia's stock price, the recent price trend is noticeably weak, falling for 7 consecutive trading days to mark its longest losing streak since 2022, with the stock price breaking below its 10-day and 20-day moving averages in succession. However, after dropping to the 60-day moving average on Monday, the stock price halted its decline and bounced back on Tuesday, showing that this moving average provides a degree of support, though it does not yet indicate that the correction has ended.
On the downside, the primary support level to watch is the $200 mark. Meanwhile, this level sits above an upward trendline formed by connecting the 144-day moving average and previous candlestick lows, potentially creating a confluence of support. If this level fails to hold, the stock price may test downward toward $190, and if it continues to fall, the stock price could drop toward around $170.
On the upside, the primary resistance level to watch above is the $228-$230 range. If the stock price breaks out and holds above $230, it will continue upward to challenge its all-time high of $236.54. If the stock price sets further record highs, it is expected to advance toward the $300 mark.
This content was translated using AI and reviewed for clarity. It is for informational purposes only.
Recommended Articles












Comments (0)
Click the $ button, enter the symbol, and select to link a stock, ETF, or other ticker.