


Bitcoin Price Forecast: Bitcoin Holds Above $82,000, Can ETF Inflows Push Price Past $87,000?



AI Podcast


On Saturday (October 10), Bitcoin traded near $82,700, extending a rebound from a weekly low of $80,400. The recovery is driven by improving macroeconomic sentiment—specifically easing Middle East tensions following U.S.-Iran talks—and a modest $21.1 million net inflow into U.S. spot Bitcoin ETFs on October 9, which ended a two-day outflow streak. However, persistent high U.S. Treasury yields and weak cumulative weekly institutional demand suggest cautiousness. Technically, the 14-day RSI at 51 and bullish MACD indicate a short-term recovery phase, with immediate resistance at $83,000–$83,500 and key downside support at the $80,000 psychological level.

TradingKey - On Saturday (October 10), Bitcoin (BTC) extended its rebound from the previous trading session. As of press time, Bitcoin was trading near $82,700, up slightly for the day. On Friday, Bitcoin gained about 1.1%, touching near $83,500 intraday after falling to around $80,400 on Thursday. Although prices have recovered some losses, they have yet to effectively break above $83,000, and the short-term trend remains in a post-adjustment recovery phase.
US-Iran Talk Expectations Improve Market Sentiment as ETF Capital Ends Two-Day Net Outflows
The recent rally in Bitcoin has been primarily driven by an improving macroeconomic environment and shifts in spot ETF capital flows.
On Friday, U.S. President Trump stated that constructive talks were underway between the U.S. and Iran, and that the U.S. would not launch military strikes against Iran before the November midterm elections. The news pushed international oil prices down intraday while the U.S. dollar weakened temporarily, providing some support for risk assets such as Bitcoin.
Earlier, uncertainty over Middle Eastern crude oil supply drove energy prices higher, exacerbating market fears of persistently high U.S. inflation. The 10-year U.S. Treasury yield briefly surged above 5.3% as the U.S. dollar strengthened alongside it, limiting upside potential for the crypto market. While falling oil prices have eased concerns over further interest rate hikes, the 10-year U.S. Treasury yield remains around 5.24%, leaving uncertainty over Federal Reserve monetary policy unresolved.
In terms of capital flows, U.S. spot Bitcoin ETFs recorded $21.1 million in net inflows on October 9, ending two consecutive trading days of outflows. According to data from Farside Investors, net outflows stood at $484.9 million on October 7 and $244.1 million on October 8, bringing the two-day cumulative net outflows to approximately $729 million.
However, Friday's capital inflow was relatively limited and insufficient to offset the prior outflows. From October 5 to October 9, spot Bitcoin ETFs logged cumulative net outflows of around $679 million, signaling that recent institutional demand remains weak.
Bitcoin Technical Analysis
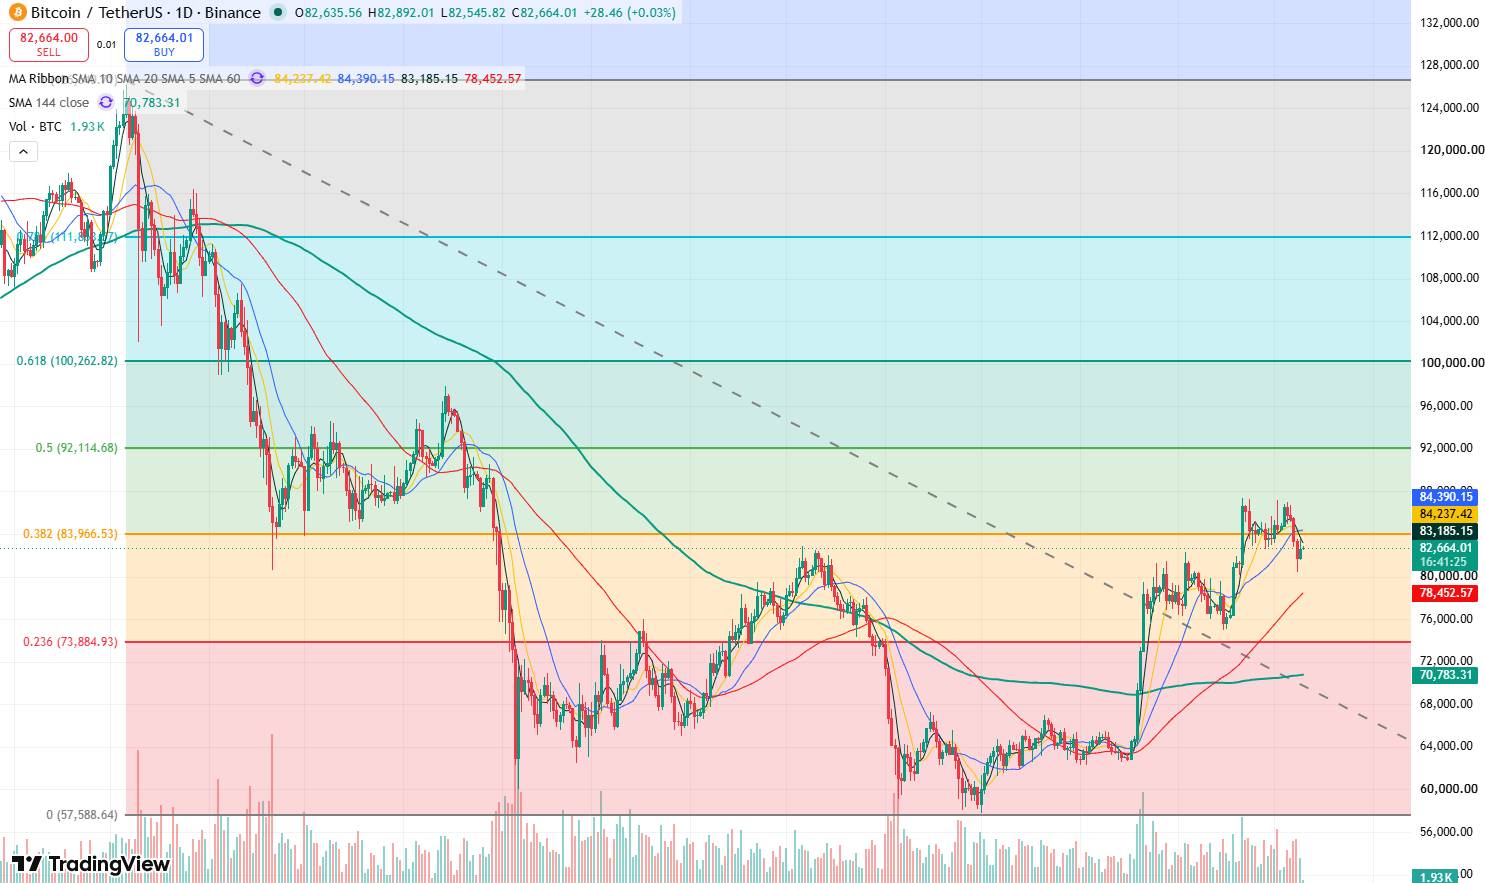
Bitcoin Price Daily Chart, Source: TradingView
Looking at Bitcoin's daily chart, Bitcoin pulled back continuously after rising to near $87,000 on October 5, subsequently falling below $85,000 and $83,000, and touching around $80,400 on October 8. The current price has rebounded to $82,700, indicating that short-term downside momentum has somewhat weakened, though the weekly decline still exceeds 4%.
Regarding technical indicators, the 14-day RSI stands near 51, in neutral-to-bullish territory, while the MACD has turned bullish, reflecting a recovery in short-term buying interest. The price may continue its rebound in the short term.
To the upside, initial focus is on the resistance zone of $83,000–$83,500, with $83,500 close to Friday's intraday high. If Bitcoin can effectively break through this area, the next resistance will target $85,000; after further establishing a foothold above $85,000, near $87,000 will become the new key target.
To the downside, initial focus is on support at $82,000. If the price falls back below this level, it may retest near $81,500, with further support located in the $80,300–$80,000 area. Among these, $80,000 is a key recent psychological level; if this level gives way, short-term downside room could expand further.
This content was translated using AI and reviewed for clarity. It is for informational purposes only.
Recommended Articles











Comments (0)
Click the $ button, enter the symbol, and select to link a stock, ETF, or other ticker.