


AMD Drops Nearly 20% From Highs Ahead of Earnings; Can $1 Trillion Market Cap Still Be Achieved?



As of Eastern Time July 31, AMD closed at $476.15, down 1.90% and retreating 18.5% from its peak. Despite a 120% year-to-date gain, market scrutiny over high valuations and AI investment sustainability has triggered a correction, exacerbated by significant insider selling. Technically, the stock remains in a long-term uptrend but faces short-term resistance near $515. Upcoming Q2 earnings are critical, with performance in data center growth and product scaling dictating whether the stock can resume its path toward a $1 trillion market capitalization or face further downside toward the $400 support level.

TradingKey - On July 31, Eastern Time, AMD ( AMD) closed at $476.15, corresponding to a market capitalization of approximately $776.41 billion, down 1.90% on the day. Following a recent round of intense volatility, the stock price has retreated nearly 18.5% from its all-time high of $584.
For AMD investors, the core issue at present is that the stock still maintains a year-to-date gain of about 120%, and to break through a $1 trillion market capitalization, it still needs to rise by about 29%. Meanwhile, the threefold logic that supported the previous rally—exploding AI chip demand, high valuation premium, and insider confidence—is being scrutinized one by one by the market.
Why AMD Stock Is Falling
Around the July 22 Advancing AI 2026 conference, AMD's stock price experienced significant volatility. The stock closed at $541.98 on the day of the conference, but subsequently, hit by a systemic sell-off in the chip sector, fell by over 10% intraday on July 29, with an overall decline of more than 10% for the month. Although it surged 13% in a single day on July 30, catalyzed by Microsoft's ( MSFT) strong earnings report, it still had not fully recovered its lost ground as of Friday's close. Over the same period, Nvidia ( NVDA) registered a relatively mild decline, and the Philadelphia Semiconductor Index also experienced a correction, with AMD's decline significantly exceeding the sector average.
This divergence in performance is closely tied to AMD's high starting valuation. The current stock price trades at a forward P/E ratio of approximately 63 times, higher than that of Nvidia and the median of the Philadelphia Semiconductor Index components. The market has already priced in the most optimistic expectations for AMD—continued expansion of the AI chip market, AMD capturing market share from Nvidia, and its ROCm ecosystem catching up to industry standards. Should any of these expectations fall short, the pressure for valuation correction will be significantly greater than for its peers.
On the surface, this looks like profit-taking, but the deeper reason is that skepticism over the sustainability of AI investment is shaking the valuation foundation of the entire chip sector.
Insider activity also corroborates this. According to SEC regulatory filings, AMD insiders have concentrated their selling over the past few months, with several executives, including CEO Lisa Su and CTO Mark Papermaster, offloading shares.
Institutions also show a clear divergence on AMD's price target. Wedbush raised its target price from $450 to $600, and Mizuho lifted theirs from $415 to $615. However, William Blair initiated coverage in July with a 'Hold' rating, arguing that the current valuation reasonably reflects the balance between AI demand and competitive risks.
In conclusion, AMD's decline does not stem from deteriorating fundamentals, but rather reflects the market's reassessment of the sustainability of AI investment, which has triggered a systemic valuation correction across high-valuation tech stocks.
AMD Stock Price Technical Analysis
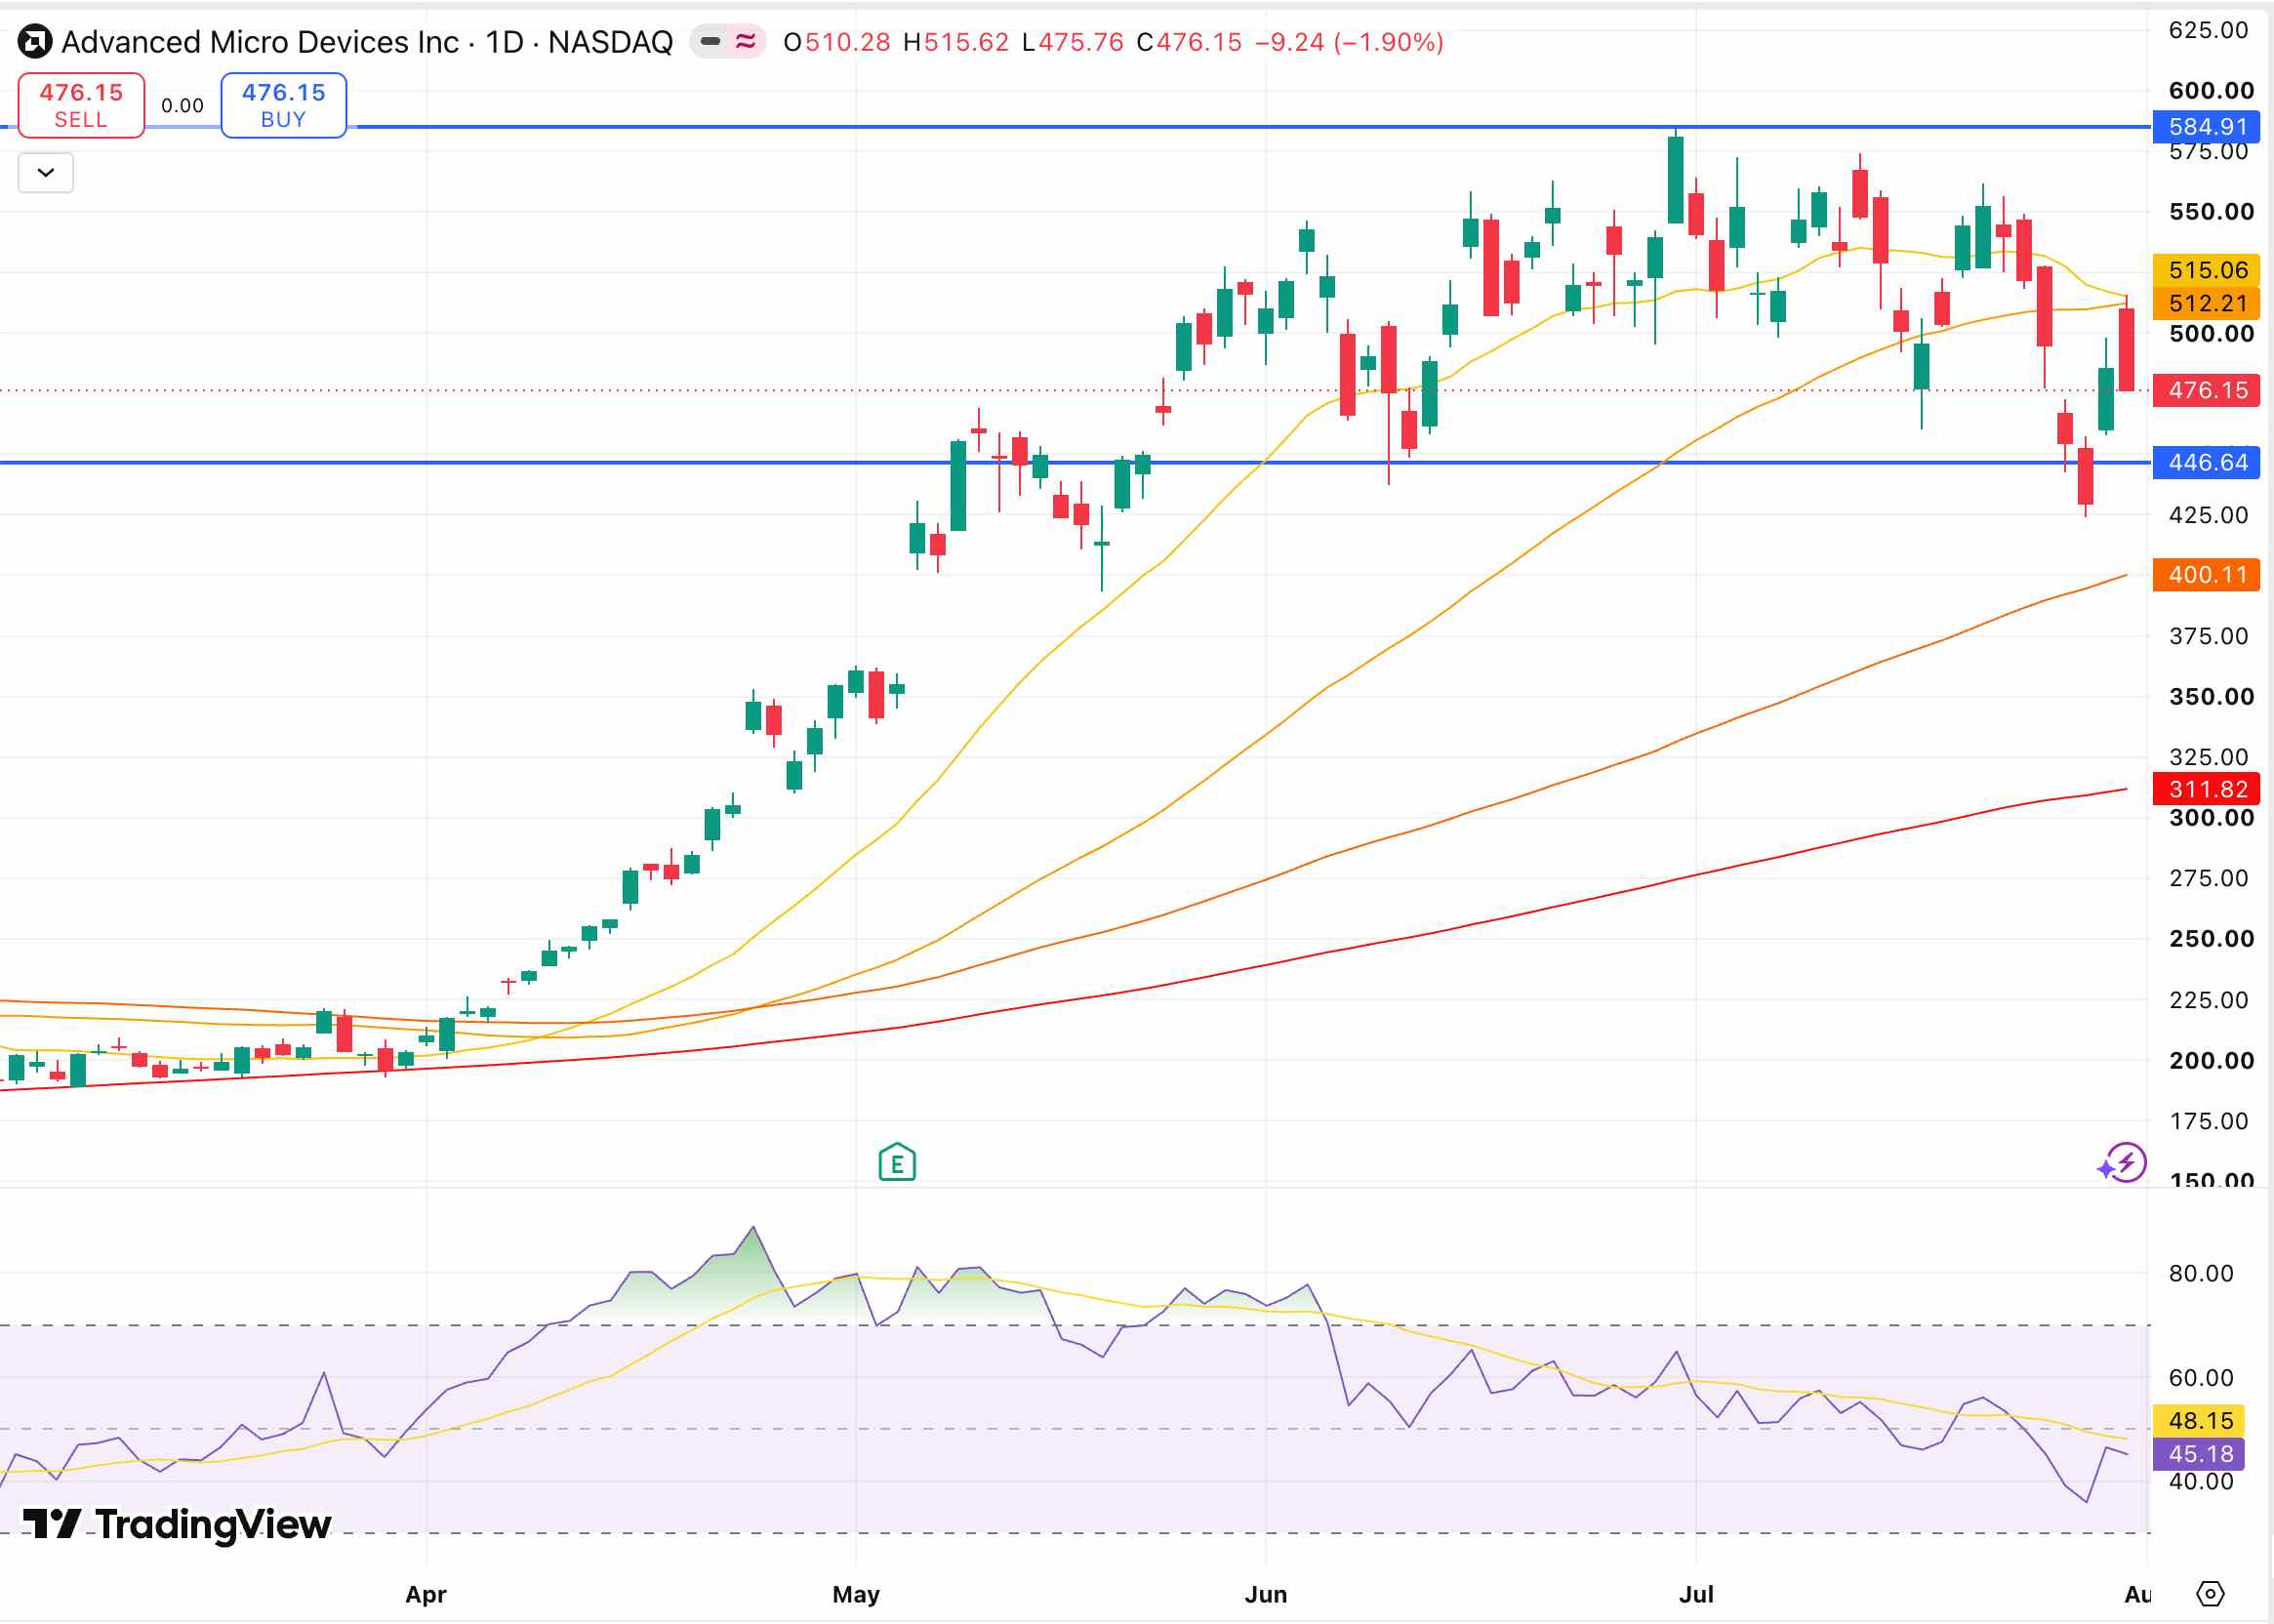
[Source: TradingView]
As of the close on July 31, AMD was trading at $476.15. After a strong rebound of approximately 13% on July 30, the stock price has temporarily stabilized.
Regarding short-term moving averages, the current stock price remains about 7.5% below its 20-day moving average (approximately $515) and about 7% below its 50-day moving average (approximately $512), indicating that the short-term downtrend has not yet fully reversed. However, the stock price remains above its 100-day moving average (approximately $400) and 200-day moving average (approximately $312), keeping the long-term uptrend intact.
In terms of the RSI indicator, the Relative Strength Index has rebounded from near-oversold territory to a neutral level of approximately 45.18, indicating that technical pressure has eased.
As for key support and resistance levels, the key short-term level to watch is around $498, which represents a previous low-rebound zone and a critical support level that was recently breached. If the stock price can reclaim $498 on high volume, it could challenge the cluster of moving averages (approximately $511-$517); otherwise, this level may turn into resistance. A more critical long-term support below lies near the 100-day moving average of around $400.
In terms of options market signals, traders expect a single-week price fluctuation of approximately 10% following the earnings release. Based on Friday's closing price of $476.15, a 10% gain would push the stock toward $527, while a 10% decline could drag it below $430.
AMD Earnings Ahead: Is a Trillion-Dollar Valuation Still Within Reach?
AMD will report its second-quarter earnings after the market close on Tuesday, August 4. The market consensus expects Q2 revenue of approximately $11.3 billion and earnings per share of $1.61. Of the 9 analysts tracked by Visible Alpha, 7 rate the stock a Buy, 2 are Neutral, and none rate it a Sell, with an average target price of $582, representing an upside of over 20% from Friday's close. The following four metrics will determine the post-earnings direction:
Whether data center revenue growth can remain above 50%; whether MI350/MI450 shipments are ramping up or constrained by capacity; whether there is any softening in the Helios delivery guidance; and whether the full-year revenue guidance can hold up to market expectations.
If earnings beat expectations, AMD needs to break through the dense moving average zone (around $511-$517) on high volume for hopes of restarting the trillion-dollar target. If earnings miss expectations, the lower Bollinger Band near $446 will be the first line of defense, and a breach could lead to a further test of the $400 level.
AMD's fundamentals are indeed improving. The data center business has grown into a profit pillar, and Helios is driving the upgrade of the business model from chip sales to system solution output. Roth Capital analysts noted that Helios has secured clients such as Meta, OpenAI, Oracle, and Anthropic. However, the year-to-date gain of approximately 120% has already priced in most of the positive news. Against the backdrop of Michael Burry increasing his short positions, collective insider selling, and spreading doubts over 'circular financing,' the risk-reward ratio of chasing the rally at this point is not favorable.
In the medium to long term, if the structural growth thesis of the AI chip market materializes, the trillion-dollar target is not out of reach; Baird analysts have even given a Street-high target price of $1,250. However, in the short term, a full correction is more likely required before completing the sprint. Only after the earnings results are released will the direction become truly clear.
This content was translated using AI and reviewed for clarity. It is for informational purposes only.
Recommended Articles









Comments (0)
Click the $ button, enter the symbol, and select to link a stock, ETF, or other ticker.