


COIN Stock Price Forecast: Morgan Stanley Cuts Price Target by Over 50% to $120, COIN Risks Falling to $100



AI Podcast


As of November 5 Eastern Time, Coinbase shares dropped 9.69% to $136.82 amid weak crypto trading activity. Morgan Stanley downgraded the stock to Underweight, slashing its price target from $258 to $120 while cutting long-term revenue and EBITDA forecasts. Q3 revenue fell 35% year-over-year to $1.22 billion, driven by lower transaction fees, though non-trading segments are expanding. Technically, the stock remains in a medium-term correction, trading below major moving averages with strong bearish momentum. Breaking below key support at $145 opens downside potential toward the $115 level, while overhead resistance clusters near the $145–$150 range.

TradingKey - As of the close on November 5 Eastern Time, Coinbase (COIN) shares fell 9.69% to close at $136.82, hitting an intraday low of $133.5, a new low since February 2024. Technical analysis shows that the stock's weekly chart continues to trade below major moving averages, and the medium-term correction structure has not significantly changed.
Morgan Stanley Cuts Price Target by Over 50% to $120
Morgan Stanley recently downgraded Coinbase to Underweight from Neutral and slashed its price target from $258 to $120, a cut of more than 53%. Analyst Michael Cyprys noted that subdued cryptocurrency trading activity recently, coupled with a weakening revenue outlook, has dampened confidence in the pace of Coinbase's earnings recovery.
Meanwhile, Morgan Stanley lowered its future earnings forecasts for Coinbase. Specifically, the 2027 revenue forecast was cut by 28% and the adjusted EBITDA forecast was lowered by 47%, while 2028 revenue and adjusted EBITDA forecasts were trimmed by 18% and 25%, respectively. The bank now expects Coinbase's 2028 normalized EBITDA to be approximately $2.4 billion, about 14% below 2025 levels, while lowering the valuation EBITDA multiple from 20x to 12x.
According to Coinbase's latest earnings report, the company generated approximately $1.22 billion in Q3 revenue, down 35% year over year. Within this, transaction revenue was around $590 million, down 44% year over year, while subscription and services revenue was around $570 million, down 20% year over year. Although the company posted net income of $719 million and adjusted EBITDA of $333 million for the quarter, the decline in spot trading activity continued to weigh on transaction fee revenue.
For the stock, the key factor currently influencing COIN's share price remains whether trading activity can recover. Coinbase is expanding non-trading businesses such as stablecoins, derivatives, prediction markets, and Coinbase One. Among these, annualized revenue from prediction markets has surpassed $200 million, and Coinbase One paid subscribers have reached a record high; however, whether these businesses can offset the drop in transaction revenue in the near term will still need to be verified in upcoming earnings reports.
COIN Stock Price Technical Analysis
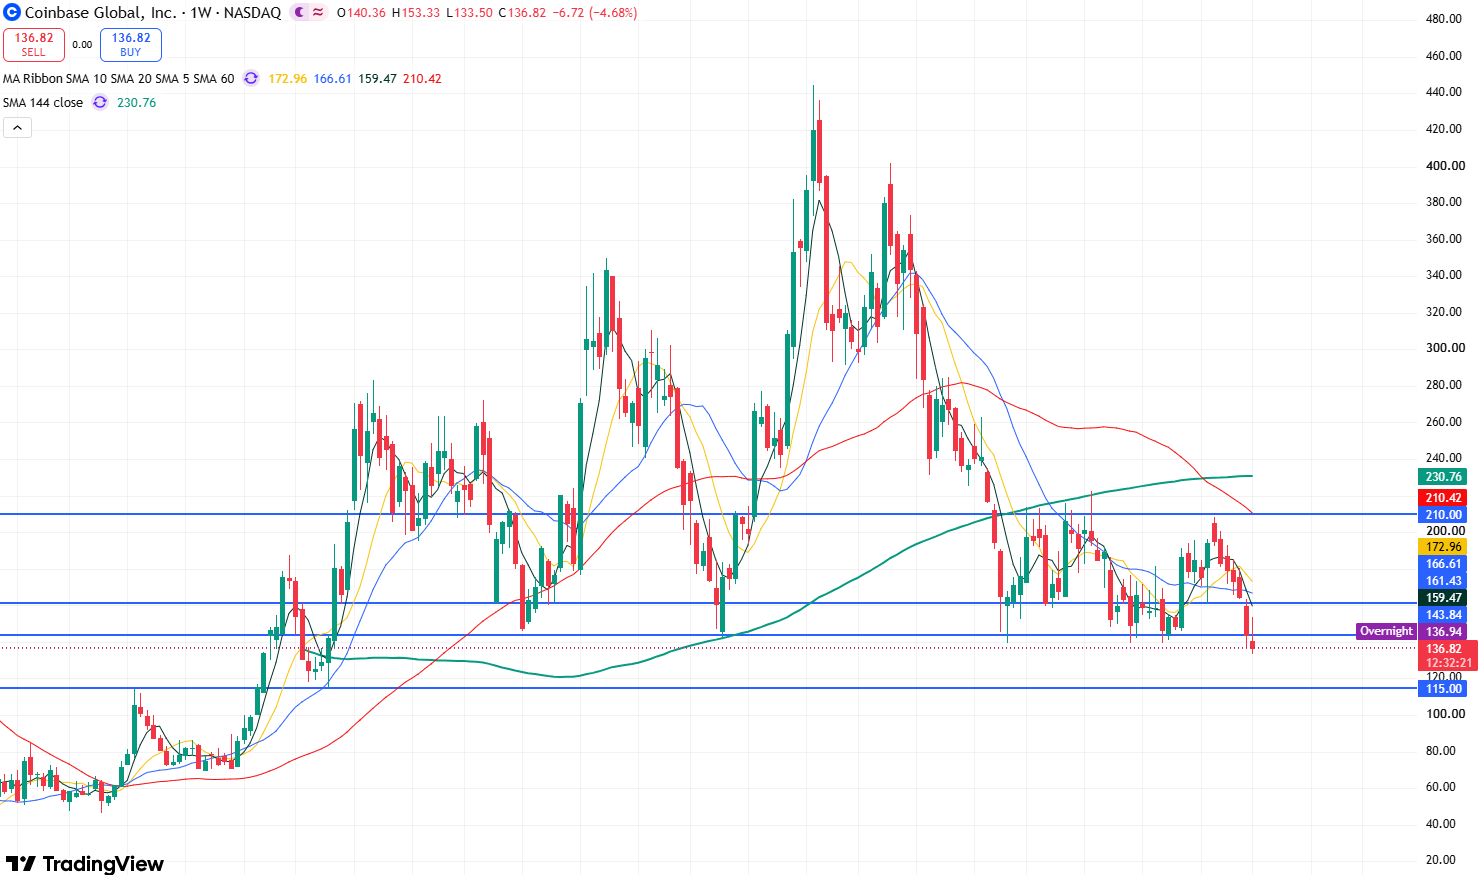
COIN stock price weekly chart, Source: TradingView
From COIN's weekly stock price chart, the stock remains in a distinct medium-term corrective structure, having fallen for a fifth consecutive week, which indicates that bears clearly dominate overall market sentiment.
In terms of moving averages, the 5-week moving average is currently around $159.47, the 10-week moving average is about $172.96, the 20-week moving average is around $166.61, and the 60-week and 144-week moving averages are near $210.42 and $230.76, respectively. The stock is currently trading below all major weekly moving averages, and the short-term moving averages sit collectively above $159, indicating that any near-term rebound still faces noticeable moving average resistance.
Meanwhile, the stock hit a fresh low of nearly two years this week, breaking below the key platform support level of $145. Bearish momentum has strengthened significantly, further opening up downside room, with the primary downside target likely testing the $115 support level. If this level fails to hold, the stock could slide further toward the $100 mark.
On the upside, the primary overhead resistance to watch is the $145-$150 range. If the stock can break above and hold firmly above $150, it could rebound further toward the resistance level near $161. If the advance continues, the stock may potentially test the $200 mark.
This content was translated using AI and reviewed for clarity. It is for informational purposes only.
Recommended Articles












Comments (0)
Click the $ button, enter the symbol, and select to link a stock, ETF, or other ticker.