

Beware AI Bubble Risk, US Stocks May Face Major Correction


AI Podcast
U.S. stocks, particularly the Nasdaq and S&P 500, exhibit bubble characteristics driven by AI theme concentration: high valuations, crowded positioning, and rising market concentration. Valuations outpace commercial realization, with massive AI capital expenditures potentially outpacing revenue growth. Index concentration is extreme, with top S&P 500 stocks heavily weighted towards AI leaders, increasing downside risk. Crowded AI trades show signs of panic selling, as evidenced by recent sharp declines in tech and semiconductor indices. Technical analysis indicates a rising likelihood of a severe correction, with breached neckline support and potential for significant further declines.

TradingKey - Over the past year, AI chips, cloud computing, data centers, and a handful of tech giants have driven the Nasdaq and S&P 500 to climb steadily, repeatedly hitting record highs. However, as more capital concentrates on the same AI theme, U.S. stocks are beginning to exhibit typical bubble characteristics: high valuations, crowded positioning, rising market concentration, and rapidly expanding capital expenditures, while actual commercial returns still need time to be verified. If the market begins to question the return on AI investment, index-level corrections could be more severe than typical sector rotations.
Bank of America has warned that red flags are appearing in U.S. stocks and suggests that investors take profits. Savita Subramanian, the firm's U.S. equity strategist, specifically noted in a report that performance dispersion within the tech sector is extreme; the gap between the best- and worst-performing stocks has reached approximately 120 percentage points, the widest since February 2000—just before the dot-com bubble burst in March 2000.
Investors Should Remain Vigilant Against Three Major Risks Stemming from the AI Bubble
The first layer of risk in the AI bubble is that valuations have outpaced commercial realization. The market has already priced in years of future demand for AI computing power, enterprise automation, cloud service growth, and productivity gains. However, in reality, AI capital expenditures are massive, with data centers, GPUs, power, networks, and cooling systems all requiring continuous investment. If AI revenue growth cannot cover capital expenditures and depreciation pressures, the market will shift from "valuing future growth" to "questioning cash returns".
The second layer of risk is excessive index concentration. The WSJ reports that the top ten stocks in the S&P 500 now account for nearly 40% of the index's market capitalization, a level rarely seen since 1965, and nearly all of these leaders are AI-related. While the index may appear diversified, it is increasingly resembling an "AI giants portfolio". This means that even if investors buy the S&P 500, they are implicitly betting on the AI supply chain. Once NVIDIA ( NVDA ), Apple ( AAPL ), Microsoft ( MSFT ), Broadcom ( AVGO ), Amazon ( AMZN) and other market leaders undergo a simultaneous correction, it will be difficult for the index to rely on other sectors for hedging.
The third layer of risk is that AI trades are already showing signs of crowding. Market data shows that on June 5, the Nasdaq Composite Index fell 4.18%, its largest single-day drop in nearly a year, primarily dragged down by AI-related semiconductor and tech stocks; meanwhile, the Philadelphia Semiconductor Index once plunged 10.3%, marking its worst single-day performance in six years. Although Morgan Stanley believes last week's pullback was merely a normal technical adjustment, it also admitted that the sell-off was concentrated in semiconductor and memory stocks, which are the most crowded areas for hedge funds and leveraged ETFs. The danger of crowded trades is that they reinforce each other on the way up but lead to a stampede on the way down.
Nasdaq and S&P 500 Technical Analysis: Likelihood of a Sharp Correction Continues to Rise
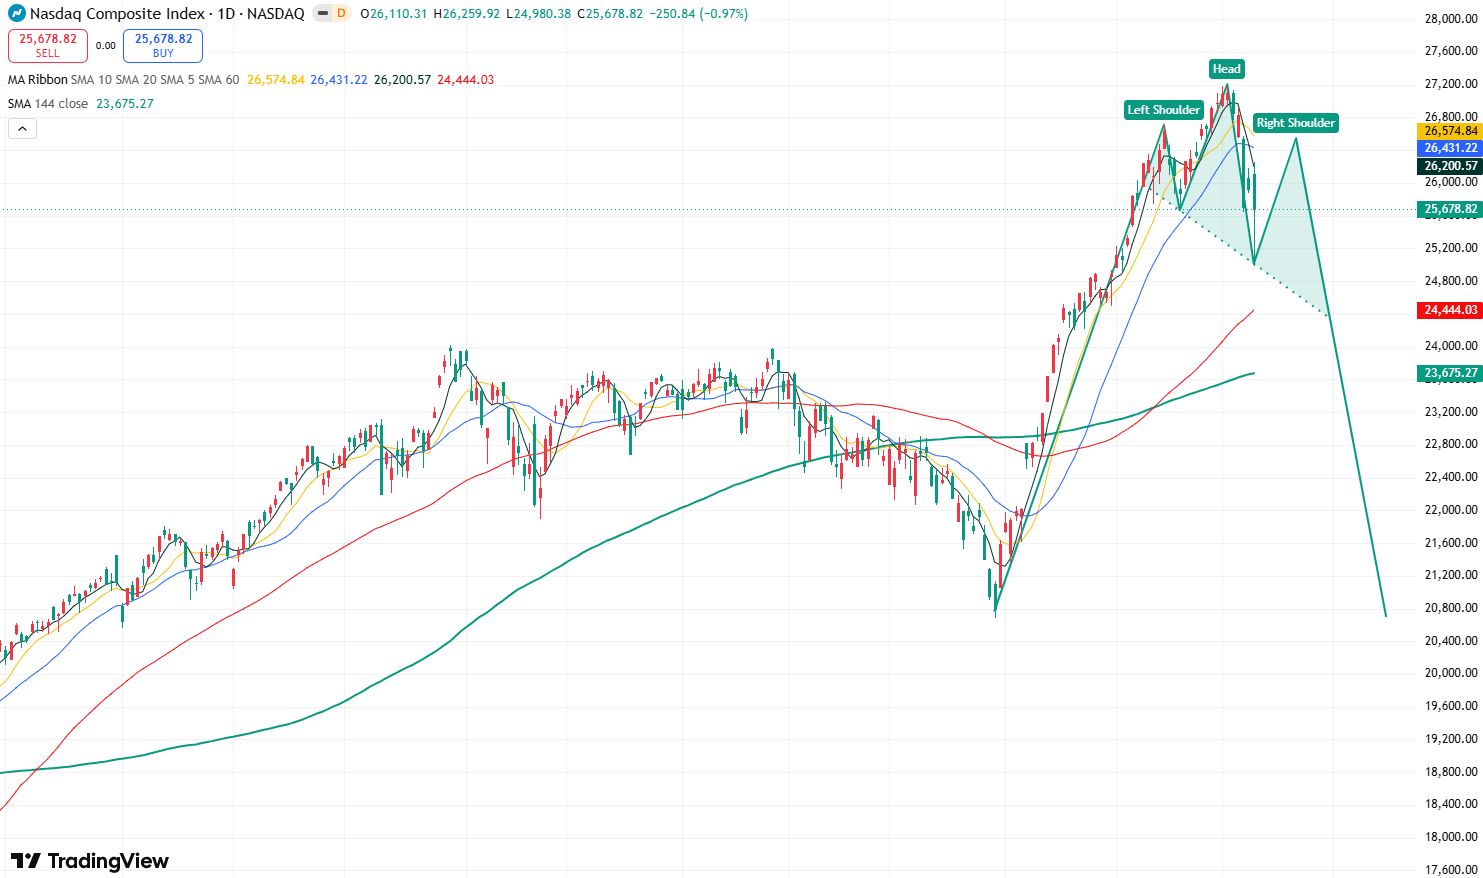
Nasdaq Daily Chart, Source: TradingView
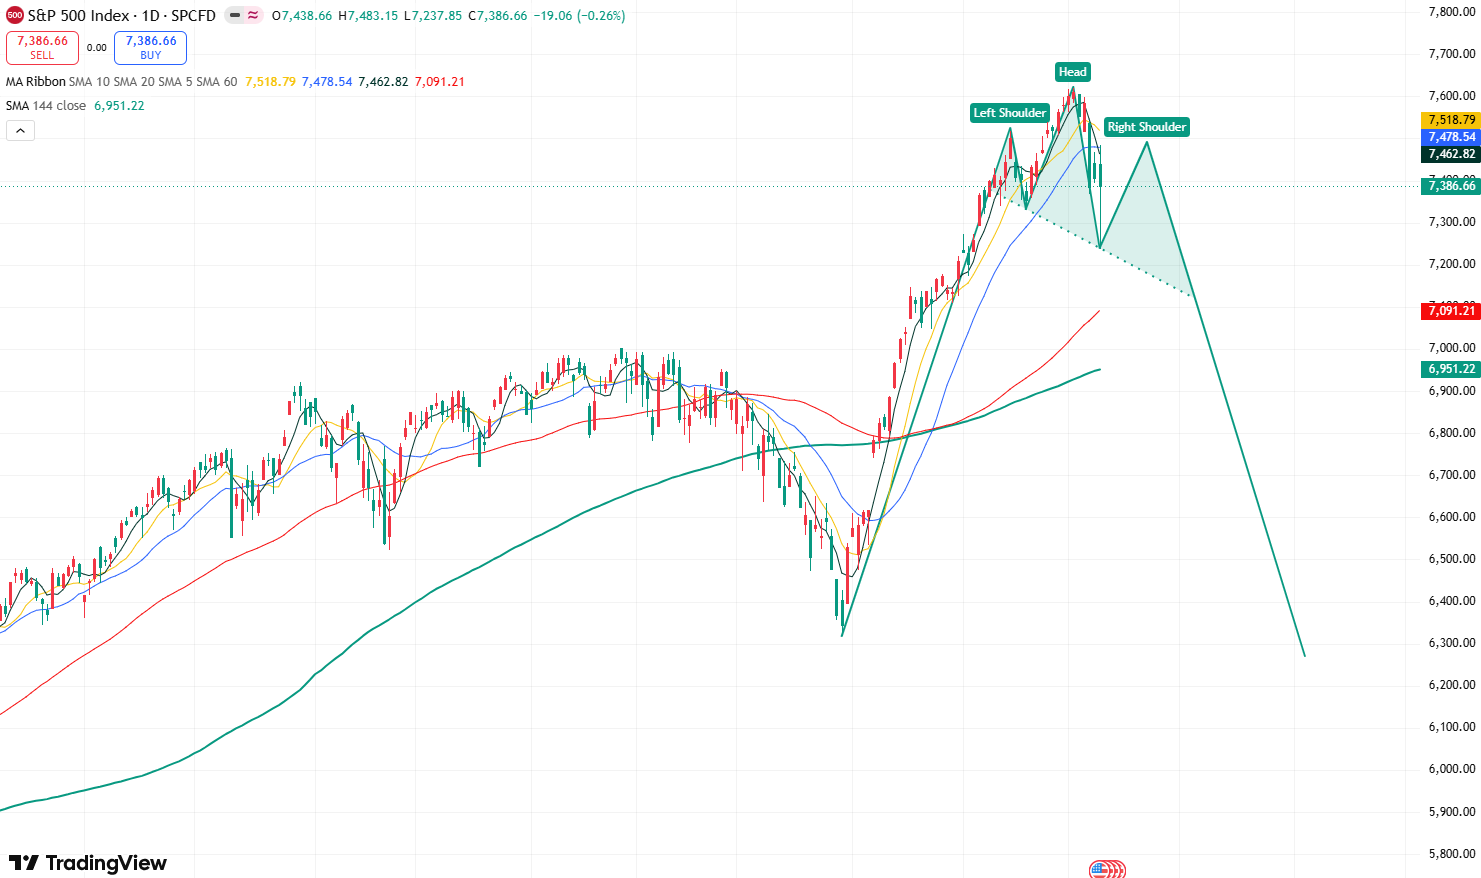
S&P 500 Daily Chart, Source: TradingView
Based on the daily charts of the Nasdaq and the S&P 500, the Nasdaq has recorded a cumulative decline of 4.8% over seven trading days since June. Its 4.18% drop on June 5 alone marked the largest single-day decline in nearly a year, while the S&P 500 fell 2.64% on June 5, its steepest one-day drop since October 2025. The performance of both indices indicates that market selling pressure is intensifying.
At the same time, the moving average systems on the daily charts for both indices show the 5-day SMA crossing below the 10-day and 20-day SMAs, forming a "death cross" pattern, which further reinforces the market's bearish momentum.
Furthermore, the candlestick structures of both the Nasdaq and the S&P 500 have formed the left shoulder and head of a "head and shoulders top" pattern. Meanwhile, the neckline levels at 25,701 (Nasdaq) and 7,333 (S&P 500) have both been breached. If the recent performance of both indices fails to effectively break above their left shoulder highs and they continue to weaken under pressure below those levels, it would mean that the head and shoulders top pattern has been fully formed on both charts, and the market's bearish momentum will be significantly enhanced.
On the downside, the Nasdaq will first test the 24,000 support level. If this level is lost, it will move further down to fill the April 8 gap of 22,000-22,650 and potentially test the 20,000 mark. As for the S&P 500, it will first test the 7,000 level, followed by the 6,600-6,750 gap and then the 6,300 mark.
Left shoulder levels for the two indices: 26,707; 7,517
This content was translated using AI and reviewed for clarity. It is for informational purposes only.
Recommended Articles


Comments (0)
Click the $ button, enter the symbol, and select to link a stock, ETF, or other ticker.