

Dollar General’s Hidden Recovery Story

- Q1 FY2025 revenue grew 5.3% YoY with 2.4% same-store sales growth and 7.9% EPS expansion.
- Gross margin improved 78 basis points YoY, while merchandise inventory per store decreased 7%, indicating better capital efficiency.
- Operating cash flow increased 27.6% YoY to $847 million, reflecting margin expansion and improved working capital management.
- Shares trade at 13.92x forward EV/EBITDA and 7.85x price-to-cash flow, below industry averages despite improved profitability trends.
Dollar General’s Quiet Reset: Deep Value Amid Strategic Recalibration
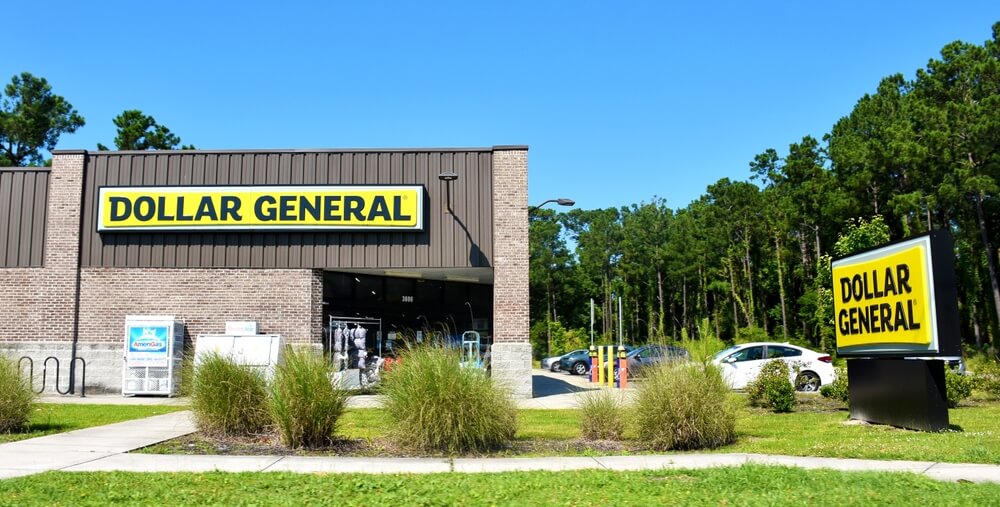
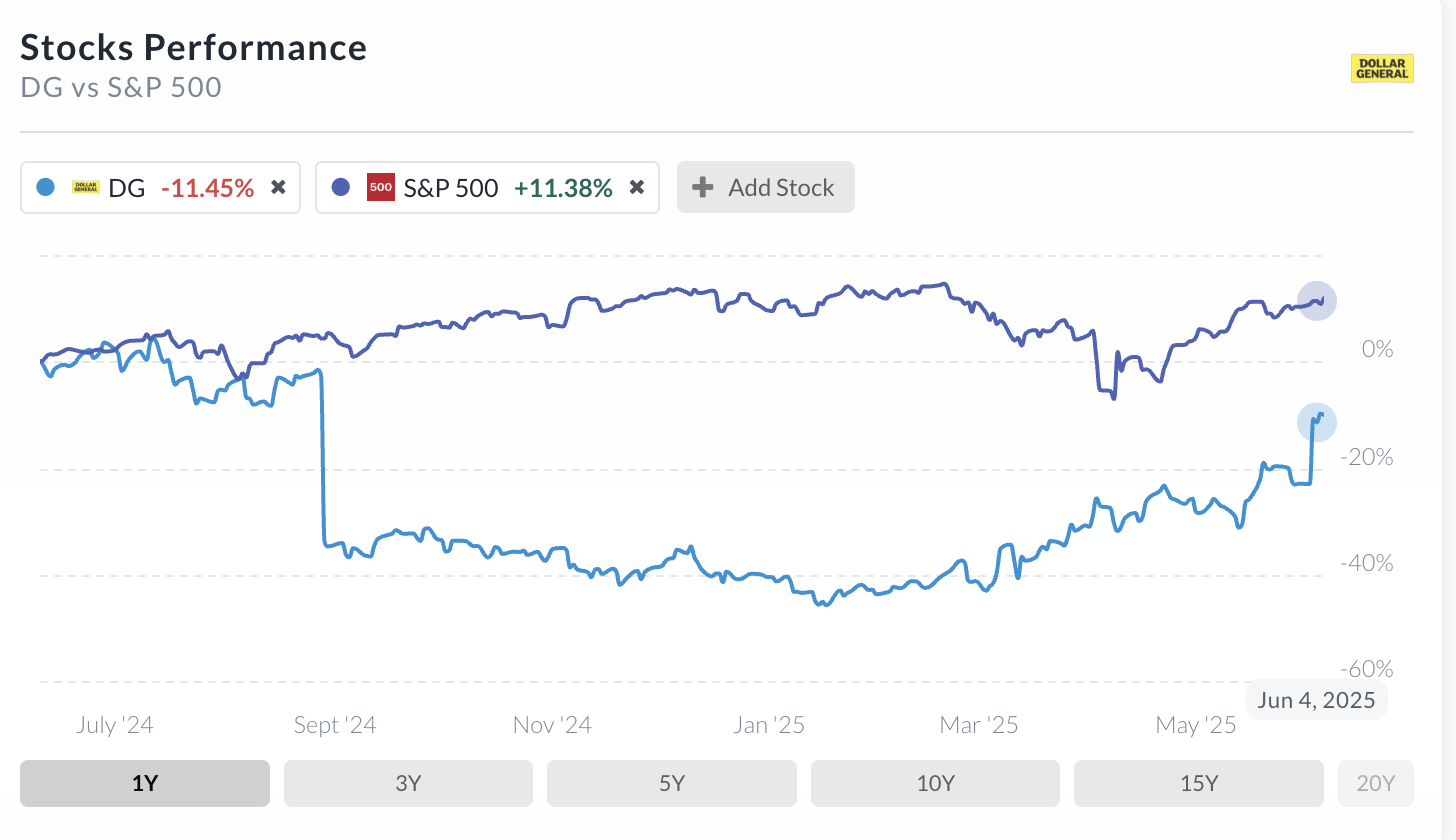
TradingKey - Dollar General (DG) has long been a stalwart of U.S. rural and suburban retail, riding a cost-friendly model and hyperlocal penetration. Yet the market is indicating a sense of shift. On reporting a good Q1 FY2025, with 5.3% top-line expansion, 2.4% same-store sales increase, and 7.9% EPS expansion, Dollar General is priced at a forward P/E of only 19.77x, lower compared to its 5-year average of 19.03x and compared to comparables like Five Below and Dollar Tree, whose prices remain high even with comparable margin challenges.
Source: Alpha Spread
Current multiple contraction is a symptom of a market struggling with whether the period of Dollar General's expansion is maturing into a margin-defense theme or whether the company is transitioning to a higher-efficiency, higher-return period. The underappreciated capital efficiency of the retailer remains a fundamental strength. With a forward EV/Sales of merely 0.97 and Price/Cash Flow at 7.85x, both well below industry norms, the market is imposing a risk premium on Dollar General that no longer seems necessary.
The valuation disconnect seems less a product of broken fundamentals and more a product of macro overhangs like tariff concerns, wage inflation, and a decelerating same-store sales rhythm. But those pressures might have spurred a strategic overhaul instead of stunting expansion. Initiatives like Project Elevate, tech upgrades, and a 4,885-store real estate pipeline suggest DG is not resting on its laurels. It's readjusting. This note discusses Dollar General's maturing business model, compares positioning to competition, and analyzes the cost structure, sustainability, and monetization framework, leading to a forward-looking valuation view.
With the company's shares at 13.92x forward EV/EBITDA (vs. 15.01x 5Y average), and cash flow starting to inflect upwards, a re-rating is potentially in progress should execution continue to be ahead of sentiment.
Embedded Scalability: Dollar General's Monetization of U.S. Proximity
The Dollar General model is powered by a high-frequency, low-ticket transaction machine fueled by logistics proximity and small-box economics. Through a network of over 20,000 locations in 47 states, the company is a master of rural saturation, capturing share in communities inconvenient to serve in a traditional big-box format. Its product category is still skewed heavily to consumables, more than 75% of sales, providing stable traffic and recession-proof demand.
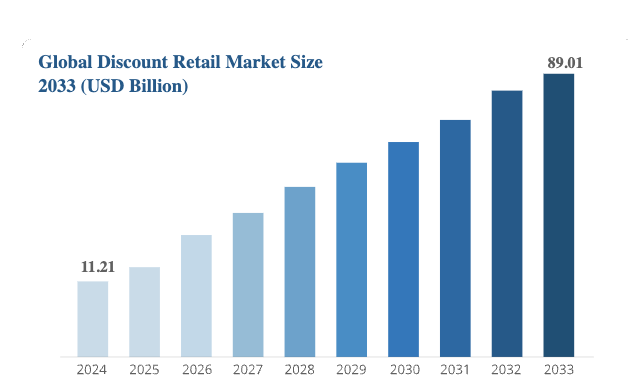
Source: Business Research Insights
But the margin story is changing. Q1 FY2025 results point to early success from its operating transformation. Gross margin improved 78 bps YoY, a substantial increase due primarily to improved markups on inventory and decreased shrinkage, a long-standing point of pain in the industry. More notably, merchandise inventory dropped 7% YoY per store, indicating improved inventory control and fewer working assets tied up in capital.
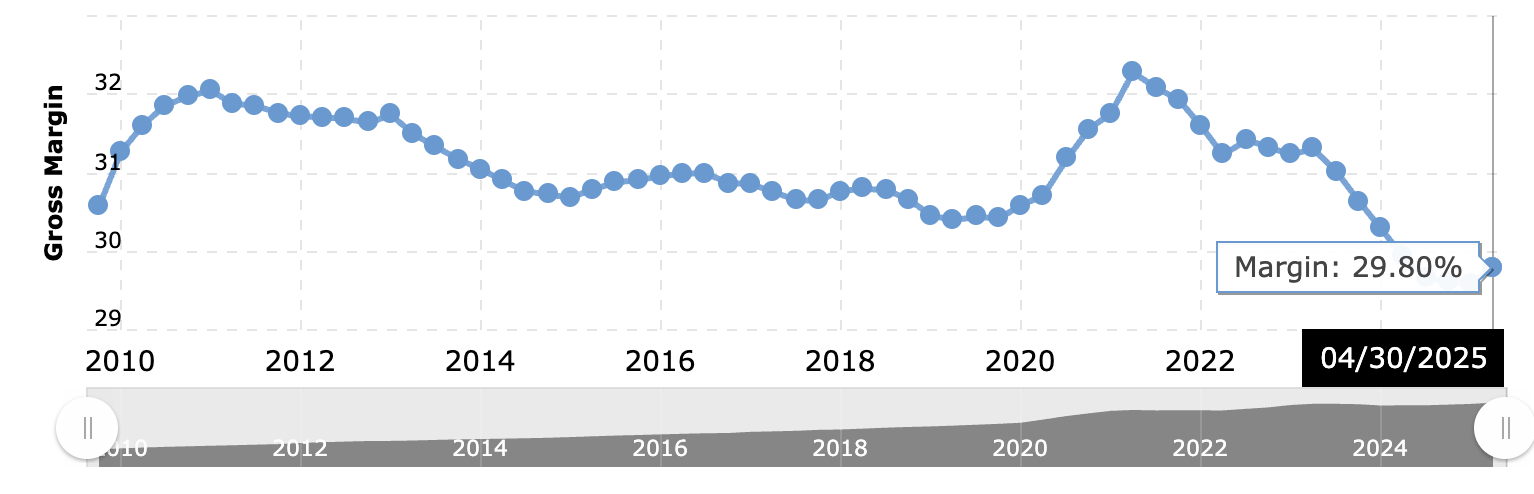
Source: Macro Trends
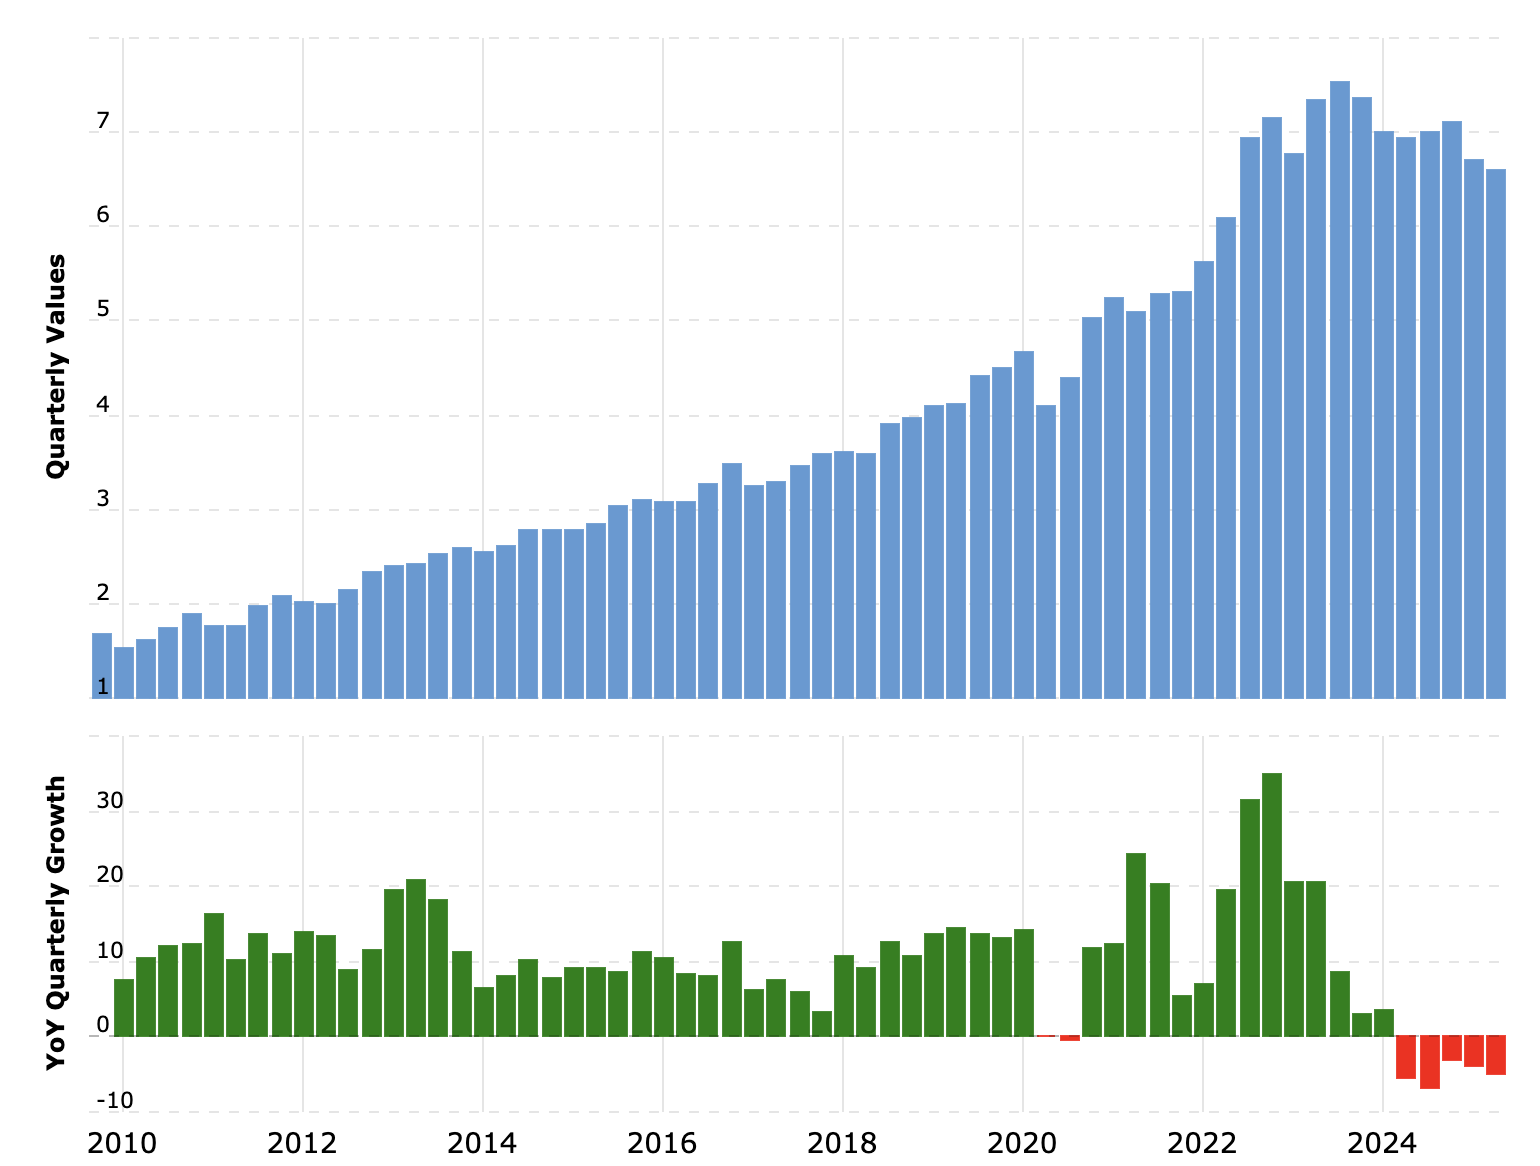
Source: Macro Trends, Dollar General Inventory 2010-2025
In tandem, even with pressures on labor and maintenance costs (see a 77 bps increase in SG&A), operating profit increased 5.5% to $576.1 million, indicating Dollar General is heading back towards margin balance after the disturbance of 2023's operations. The central retail engine is being reconfigured for increased ROI. Initiatives such as Elevate and Renovate are not cosmetic makeovers but provide an improved in-store shopper experience through better in-store navigation, improved product range, and improved shelf economics.
In addition, the company is ramping up digital modernization, with Q1 tech expenses of $12 million, to build in efficiency and grasp loyalty in an inflation-savvy shopper base. Its 27.6% YoY operating cash flow increase of ($847 million) is a reflection that execution is yielding liquidity to enable both shareholder returns and reinvestment.
The economic moat of Dollar General is still the operational density. Much of its CapEx goes not towards store count growth, but towards productivity per square foot and digital enhancement. This is a signal of an organizational move away from top-line obsession towards margin discipline, but still defending the core thesis: low-cost retail at unmatched proximity.
Losing Ground or Gaining Discipline? Reality Check of the Competitive Landscape
In the discount retail war, Dollar General is confronted by Dollar Tree, Walmart, Aldi, and increasingly by Amazon through expanding rural delivery networks. Yet, DG's store count supremacy and ubiquity are hard to duplicate. Dollar Tree is trying hard to move into consumables through Combo Store formats and Family Dollar convergences, but continues to struggle with operating unevenness and integration friction.
Walmart is not a direct equivalent to the small-box, five-minute-access DG concept, particularly in underpenetrated smaller communities where Dollar General commands zoning and cost benefits. What separates Dollar General is not location, but execution discipline. Its SKU reduction, private label expansion, and price laddering programs allow it to sustain both traffic and ticket size even during times of inflation. DG's transition from excessive exposure to volatile non-consumables to high-turn essentials has helped it sustain cash flow even during slow-growth times.
That being said, the tariff danger hovers as a leveler in terms of competition. If tariffs on Chinese imports rise further after August 2025, DG and industry peers like Five Below, with major portions of inventory originating in China, are exposed to margin squeeze risk. That said, DG's guidance suggests partial hedging and supply chain re-routing efforts are underway, mitigating the impact.
Plus, its Project Elevate remodels and store format investments provide SKU flexibility, potentially enabling quicker sourcing mix pivots than conventional box stores. As customers become ever more value-conscious and product substitution rises throughout discretionary categories, DG's strength in holding off e-commerce encroachment rests in immediacy and frequency. These are scale-resistant competitive levers and could potentially be the antidote to escalating procurement costs.
Efficiency Compounding: Earnings Quality Behind the Valuation Gap
Dollar General's top P/E ratios, 21.66x (TTM) and 19.77x (FWD), look premium compared to industry medians, but a closer look through the lens of a forensic value investor yields the valuation discount in cash flow and EV multiples.
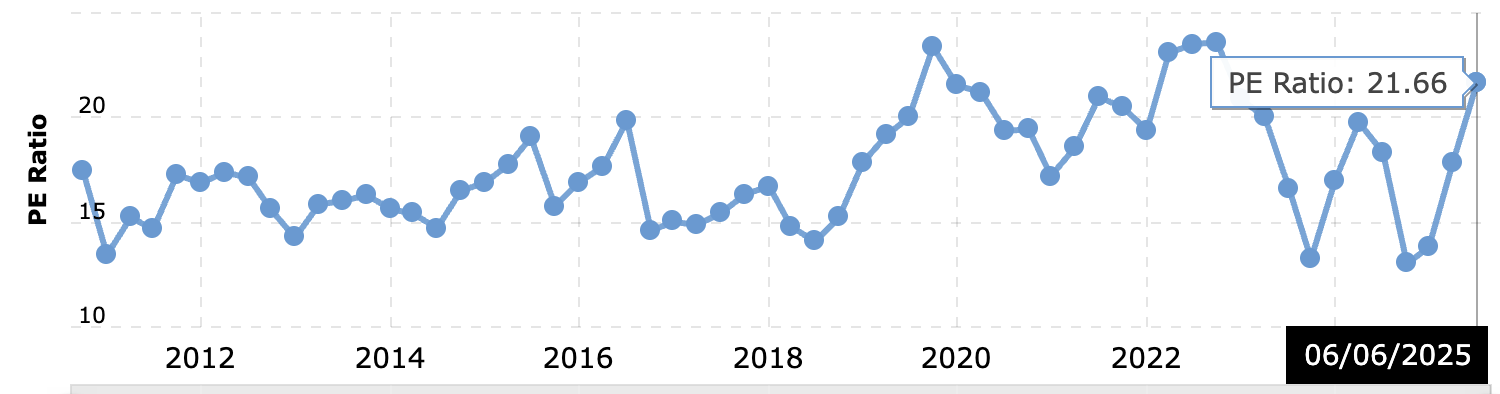
Source: Macro Trends
The company is priced at only 0.97x EV/Sales (FWD) and 13.92x EV/EBITDA (FWD), while its Price/Cash Flow is at 7.85x, lower than its 5Y average of 15.73x and industry median of 12.25x. This discrepancy implies the market is underpricing DG’s cash conversion power.
Why the dislocation? Investors are still hesitant due to uncertainty regarding tariffs, higher labor costs, and modest EPS guidance ($5.20–$5.80 in FY25). But DG's Q1 operating cash flow of $847 million, a near 28% YoY increase, speaks otherwise: margin expansion, working capital discipline, and better controls on shrinkage are yielding high-quality earnings. And with no share repurchases on the agenda in FY25 and CapEx guidance in the range of $1.3 billion –$1.4 billion, the company is investing in long-term compounding at the expense of near-term optics.
The forward EV/EBIT multiple of 21.56 (vs. 14.20 sector median) is high on initial inspection but captures the market’s valuation of DG's operating leverage and cost structure in transformation. As store remodels continue, lower shrink, and tech modernization, EBIT margins should recover quicker than expected by consensus, considering improved gross margin trajectory and subdued CapEx intensity in the next few years.
From a combined perspective through Price/Sales, EV/Sales, and Price/Cash Flow, Dollar General appears to be a value play in disguise as a fully-priced retail stock. Using a conservative 19.77x forward P/E on the high end of EPS guidance of $5.80 suggests a value range of ~$87, while a re-rating on historical EV/EBITDA of 13.89x supports a ~$128–$135 range, indicating modest upside from here, especially if macro pressures abate or consumer resilience continues.
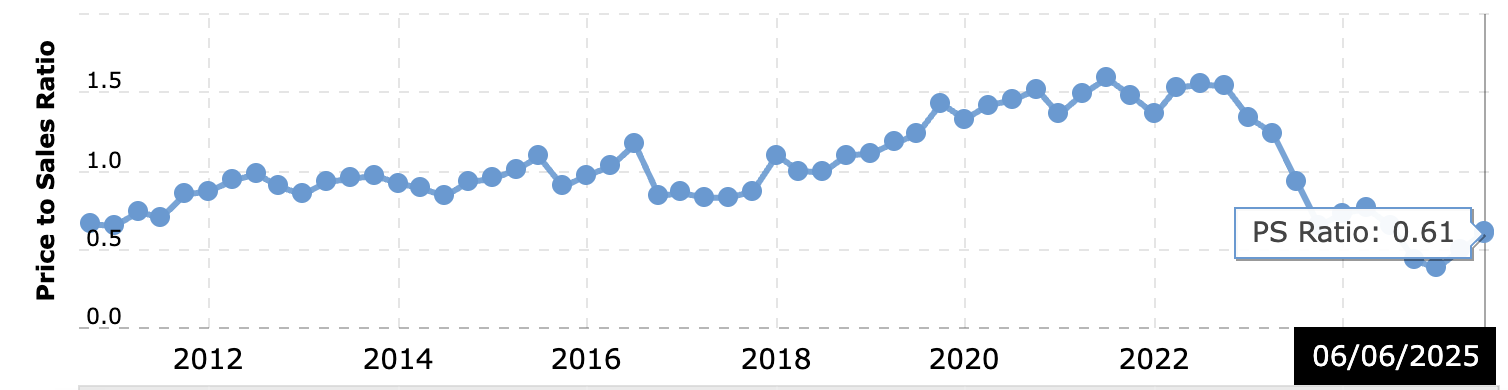
Source: Macro Trends
Risk Profile: Tariff Turbulence and Margin Tug-of-War
The major risk in Dollar General’s case rests in the dynamic tariff environment. Consumer price sensitiveness and sourcing economics could both be put to the test with the possible return of tariff rates on Chinese imports in mid-August 2025. Management acknowledges pressures, but any significant price pass-through will test volume elasticity and reduce margin expansion.
Labor inflation is a second structural headwind. SG&A rose 77bps YoY in Q1, reflecting elevated costs of labor and incentives. If wage pressures continue through 2026, especially with possible changes in regulations or minimum wage increases, the company might consider automating or further streamlining labor usage in areas where investments are only now beginning.
Also, the 0.3% decrease in traffic despite increased average ticket size implies that although long-term customers are spending more, foot traffic softness is still an issue. Ongoing traffic decline, especially if replacement digital platforms ramp up rural penetration, could cap same-store sales expansion and weaken leverage.
That notwithstanding, DG's balance sheet is still sound, and Q1's 10.8% decrease in interest expense ($64.6 million) reflects stronger debt management, providing a buffer in the face of macro uncertainty. Lack of share buybacks in FY25, while conservative, keeps liquidity in reserve in times of uncertainty.
Conclusion
However, Dollar General is not broken. It is just recalibrating. Behind quietly positive same-store sales is a cash generation machine accelerating and a strategic reset in progress. If tariff shocks remain contained and margin initiatives continue to yield results, the market is perhaps underestimating Dollar General's recovery trajectory. To value-inclined investors, DG is an exemplar of defensive retail with operating leverage optionality and long-duration time frames still in place.

Recommended Articles


Comments (0)
Click the $ button, enter the symbol, and select to link a stock, ETF, or other ticker.