

Why Major Assets Are Selling Off Across the Board?


TradingKey - Despite a broadly better-than-expected earnings season for U.S. equities, risk sentiment has shifted noticeably. On Tuesday, the market saw a sharp pullback—led by some of the very tech names that had been powering year-to-date gains. All three major indexes closed lower, sparking discussion that valuations may be coming down from an overheated stretch.
But the pressure isn’t limited to equities.
Bitcoin dropped below $100,000 on Tuesday for the first time since June—down nearly 20% from its October high of $126,272. Meanwhile, gold, considered a traditional safe haven, hasn’t been spared either. After entering technical correction territory last week, gold spent several sessions hovering just above the $4,000 level, struggling to regain momentum.
The fact that risk assets and defensive hedges are both under pressure points to a broader re-pricing of beta across the system. At the heart of that reassessment? A potential structural tightening in U.S. dollar liquidity.
▍Two Core Drivers Behind Liquidity Stress
What’s driving this tightening cycle?
Broadly, two forces are colliding: 1) A mismatch in market expectations—centered around looser monetary conditions that have not fully materialized even as rates fall, leaving front-end liquidity tight; 2) A pullback in fiscal liquidity—driven by government shutdown dynamics and aggressive Treasury cash management.
Both are now putting meaningful pressure on money markets.
▍Tighter Liquidity in a Rate-Cutting Cycle? It’s More Common Than You Think
One common question: why do liquidity strains tend to emerge just as central banks are easing policy? Shouldn’t falling interest rates improve financial conditions?
Here’s the nuance.
Rate cuts often arrive in response to economic slowdowns and softening inflation. While the early stages of monetary easing can boost short-term liquidity, that improvement hinges on real-economy traction. If growth fails to stabilize—or if there are structural fragilities in the credit system—loose policy may end up amplifying risk rather than containing it.
Markets tend to front-run easing cycles, sometimes too aggressively. Valuations get stretched, leverage climbs, and when an external shock occurs—such as a fiscal disruption, credit spread widening, or inflation rebound—the system can fracture quickly. Initial buyer enthusiasm gives way to local stress events, which can then spiral outward.
Historically, this “policy cushion illusion” has played out more than once: markets assume support, but if recession risks remain unresolved, liquidity tends to break down in asymmetrical ways.
▍When Fiscal Policy Becomes the Opposite of Stimulus
This time, part of the problem isn’t the Fed—it’s the Treasury.
The U.S. government has now entered its 35th day of shutdown, but perhaps more significantly, the Treasury General Account (TGA) has ballooned from $300 billion to over $1 trillion in just three months. That’s a $700 billion net drain from market liquidity.
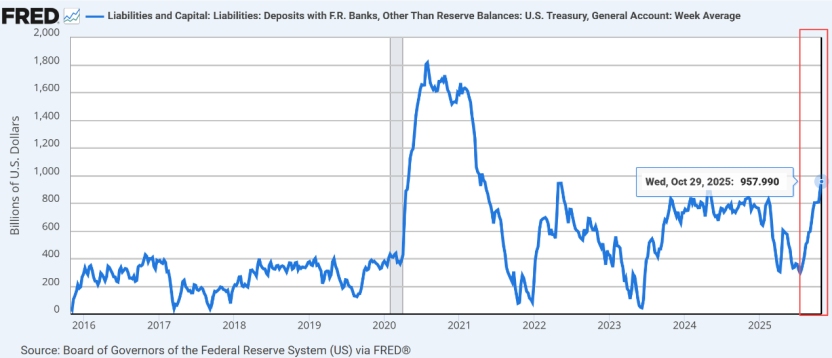
TGA expansion acts as a form of “fiscal quantitative tightening.” It effectively offsets monetary easing from the Federal Reserve, creating a dynamic where nominal policy looks loose, but actual financial conditions keep tightening. That weakens the stimulative effect of rate cuts and risks choking credit sentiment.
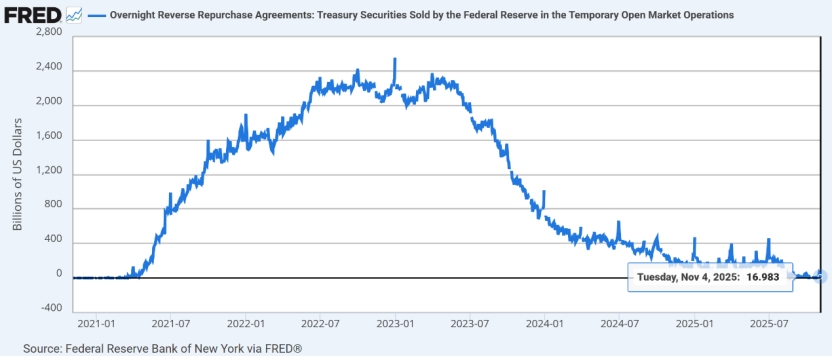
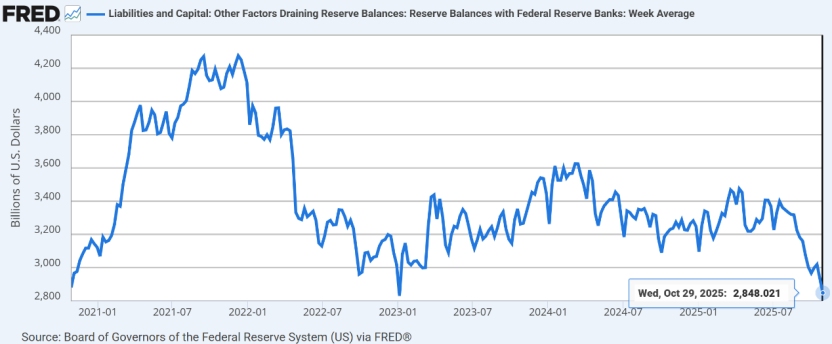
In parallel, the Fed’s reverse repo (RRP) facility—often seen as a liquidity buffer—is drying up fast. Balances have fallen to just $16 billion. Aggregate reserves now sit at $2.85 trillion, but structural signs of stress are mounting.
Another red flag: the spread between SOFR and IORB (the Fed’s interest on reserve balances). Typically, SOFR trades close to or slightly below IORB. Since late September, however, that spread has turned positive—and widened. As of November 3, SOFR had jumped to 4.2%, well above the 3.9% IORB rate.
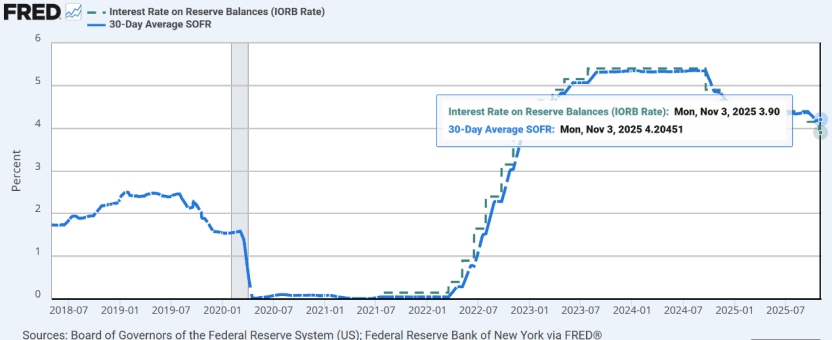
That shift is not cosmetic. It reflects stress in repo markets, rising funding costs, and tighter access to interbank capital. The longer these dislocations persist, the greater the systemic drag.
Another complication: the longer the government shutdown drags on, the more it ties the hands of fiscal planners. Treasury issuance calendars get delayed or rerouted. Spending discretion shrinks. And the policy feedback loop—between fiscal and monetary channels—starts to weaken.
As these uncertainties compound, markets begin to price in not just tighter liquidity—but systemic tightening.
And that’s where the cracks start to show.
▍Bank Credit Looks Uneasy Again
Recent headlines from smaller U.S. banks suggest these concerns are moving beyond theory.
On October 16, regional lenders Zions Bank (ZION) and Western Alliance (WAL) disclosed new losses tied to credit exposure—prompting fresh questions about regional loan books and private credit counterparties.
This isn’t SVB 2.0. At least not yet. But investors are watching closely: did the prior era of ultra-loose credit fuel unsustainable risk in places we didn’t check?
If credit appetite pulls back—and underwriting tightens—liquidity will contract further. Small businesses and high-yield borrowers are likely to feel it first. But broader knock-on effects can’t be ruled out.
The bigger risk? A mild slowdown could amplify into something reflexive. Markets expect liquidity to fade, so they sell risk. That selling pushes prices down, collateral weakens, and lenders pull back again—a self-reinforcing spiral that’s hard to arrest once it starts.
We’re not quite there yet. But Treasury draining (via TGA), reserve pools nearing exhaustion, and funding spreads widening are all surfacing at once. That’s not noise. It’s a signal that credit elasticity—system-wide—is thinning.
▍Treasuries Rally, Cash Gets Defensive Again
As risk assets slide, haven assets are showing signs of divergence. On Tuesday, mid- and long-duration U.S. Treasury yields declined, with strong demand observed for 7–10 year maturity bonds. Analysts at State Street note that this demand looks persistent—and could continue if macro volatility rises.
On the corporate side, investment-grade bonds are outperforming broad Treasuries. FactSet data shows Vanguard’s Total Corporate Bond ETF (VTC) gained 0.2% on the day, while iShares’ iBoxx Investment Grade Corporate Bond ETF (LQD) added 0.1%.
At the same time, cash appears to be reclaiming its title as the ultimate defensive asset.
Berkshire Hathaway’s latest Q3 report shows that the firm now holds $381.7 billion in cash and cash equivalents—an all-time high. Warren Buffett hasn’t bought back shares in nine months. The message seems consistent: when there’s not much to do, hold cash.
Recommended Articles


Comments (0)
Click the $ button, enter the symbol, and select to link a stock, ETF, or other ticker.