

Pepe Price Forecast: On-chain, derivatives data signal downside risk


- Pepe dropped nearly 10% on Monday, losing a crucial support level.
- The Open Interest has dropped by 8% with funding rates turning negative, signaling sell-side dominance in PEPE derivatives.
- Pepe’s total supply in profit and the holdings of large wallet investors decline, reflecting an underlying weakness.
Pepe (PEPE) edges higher by nearly 1% at press time on Tuesday, after the 9.88% drop on Monday. The meme coin fell under the $0.00001000 psychological level on Monday, with bears anticipating an extended downfall. Both the on-chain and derivatives suggest an underlying weakness that could promote further selling.
Large investors' support declines as the total supply in profit drops
Santiment data shows the large wallet investors, commonly referred to as whales, are decreasing in numbers, which is a sign of lowered support from large investors. The declining count of investors holding 100 million to 1 billion PEPE has reached 41,058, from 41,506 (monthly high) on August 9.
Similarly, cohorts with over 1 billion PEPE have declined to 9725, from the monthly high of 9815 on August 15.
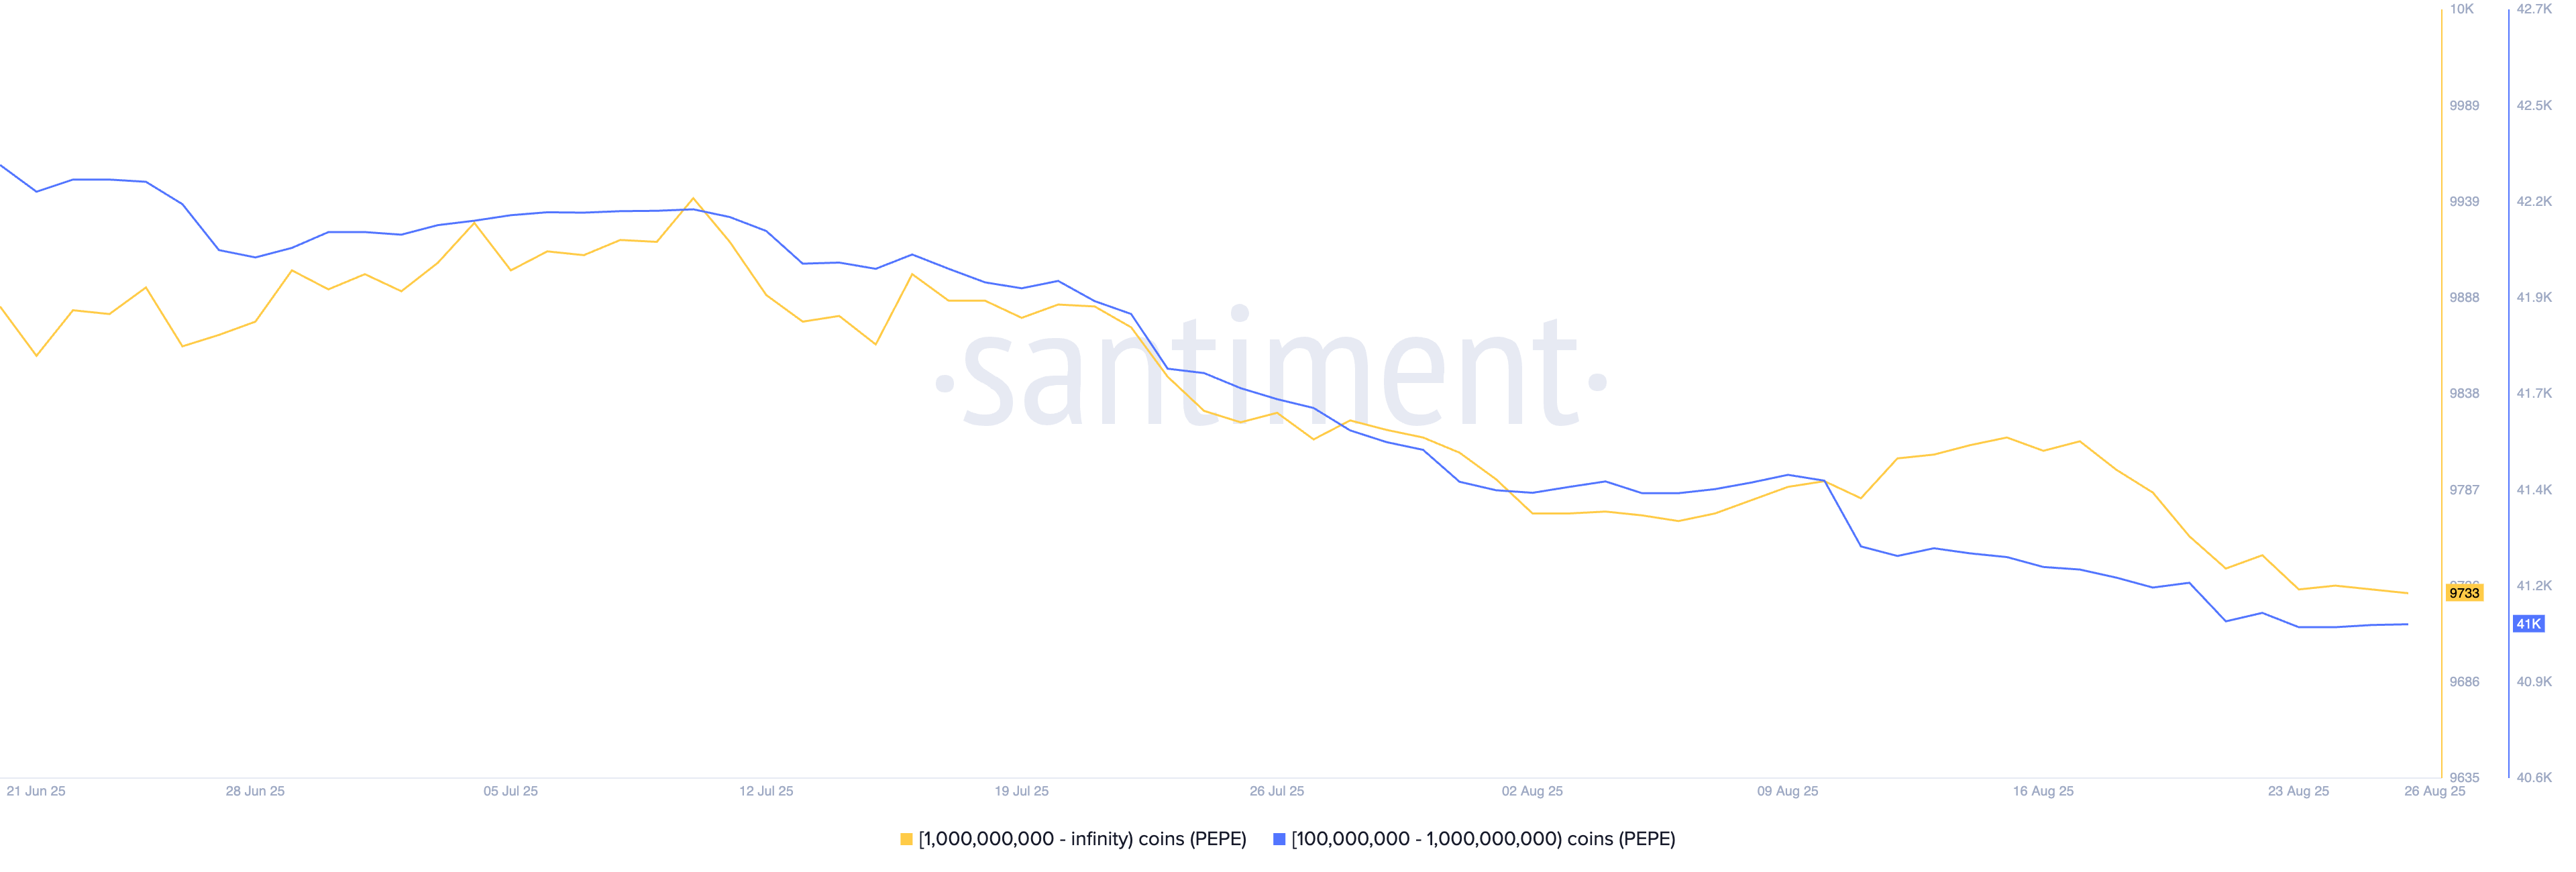
PEPE supply distribution by addresses. Source: Santiment
As whales exit, the percentage of total supply in profit, tokens purchased at prices lower than the current market price, has dropped to a two-month low of 37.63%. This decline in “in the money” token share highlights increased overhead pressure.
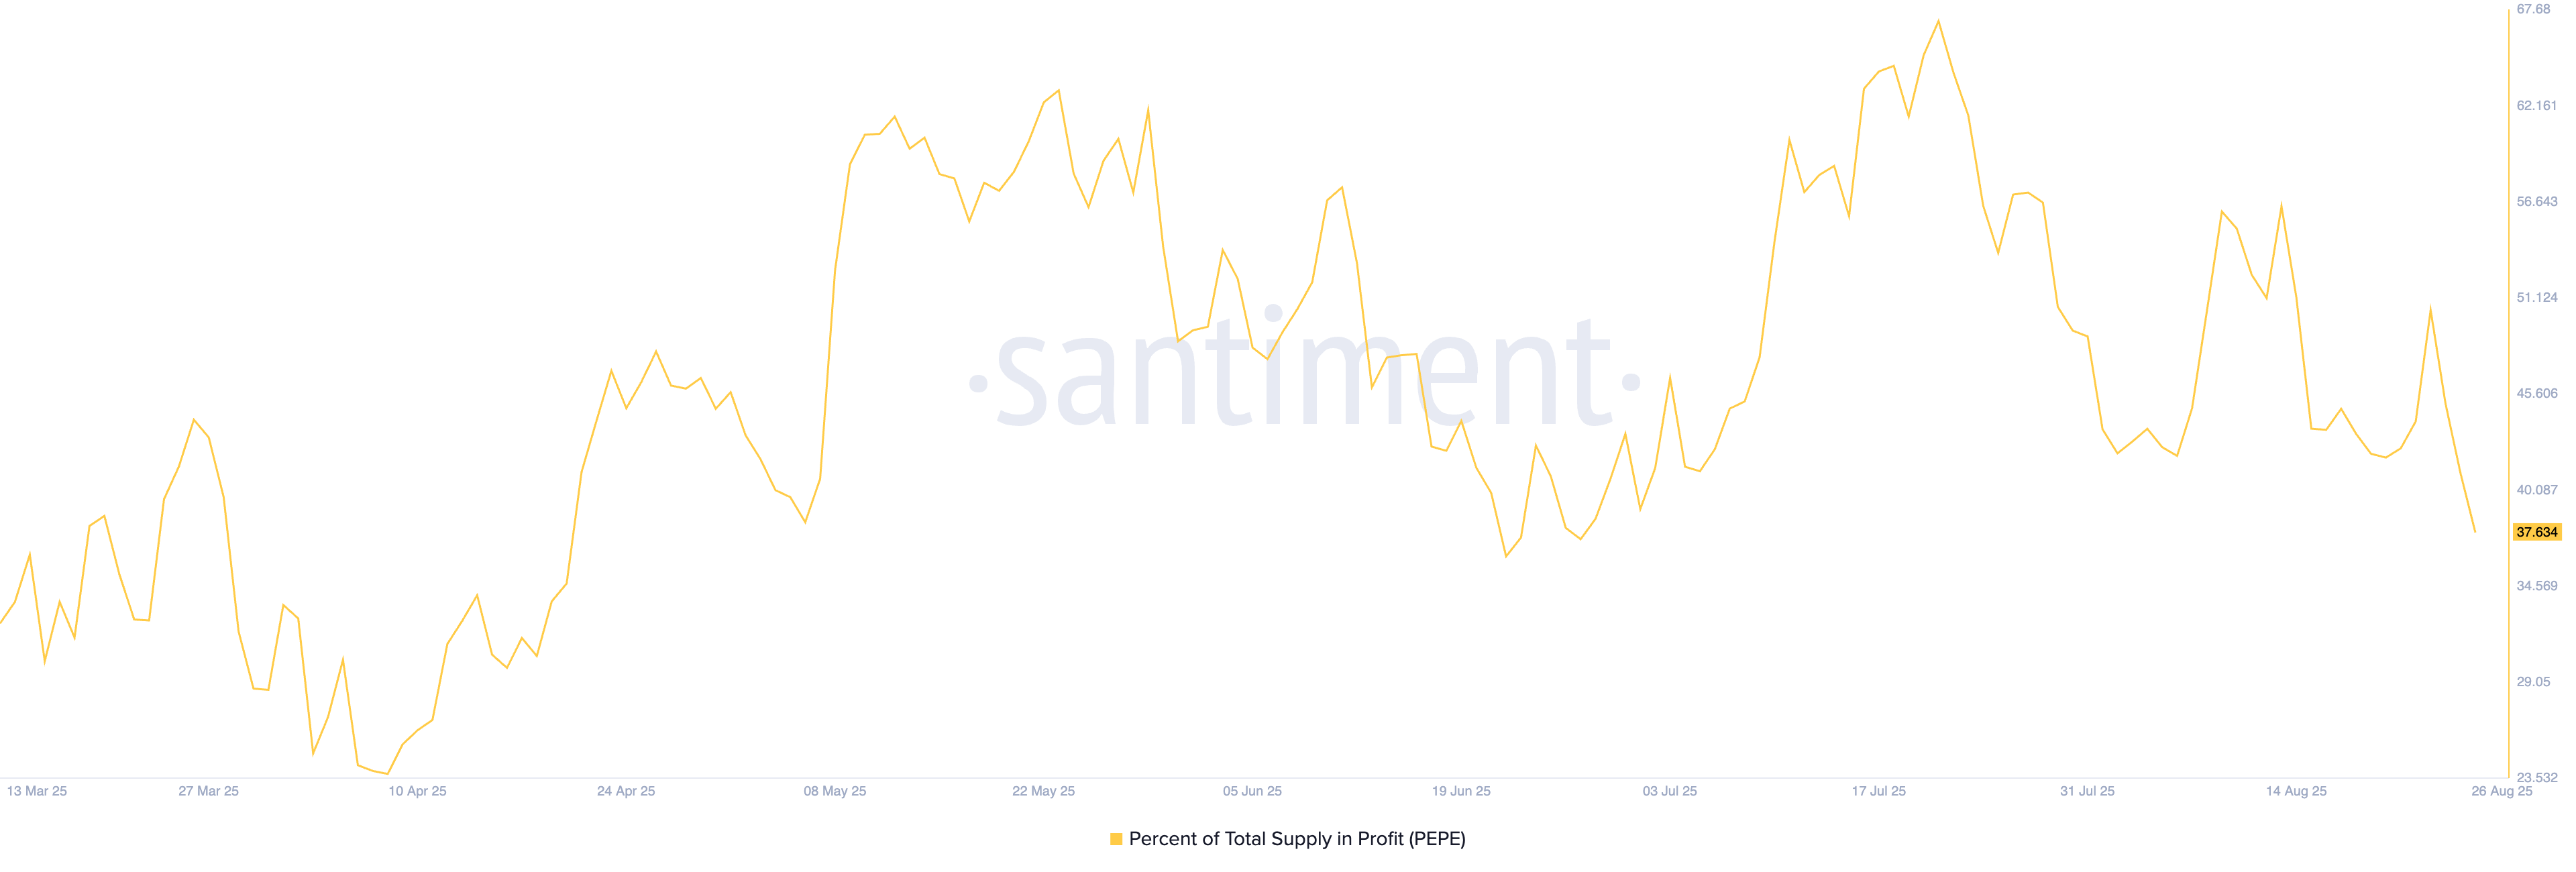
Percent of total supply in profit. Source: Santiment
Capital moves out of PEPE derivatives
CoinGlass data indicates that the PEPE Open Interest has declined by 8% over the last 24 hours, reaching $556.95 million. A capital outflow of such a degree, due to liquidations or the closing of PEPE futures or options contracts, suggests declining investor confidence, as market sentiment shifts to risk-off.
The negative shift in funding rates to -0.0168% indicates a sell-side dominance as bearish players are willing to pay the premium required to balance spot and swap prices. Additionally, the long/short ratio is down to 0.8975, indicating a greater number of active short positions.
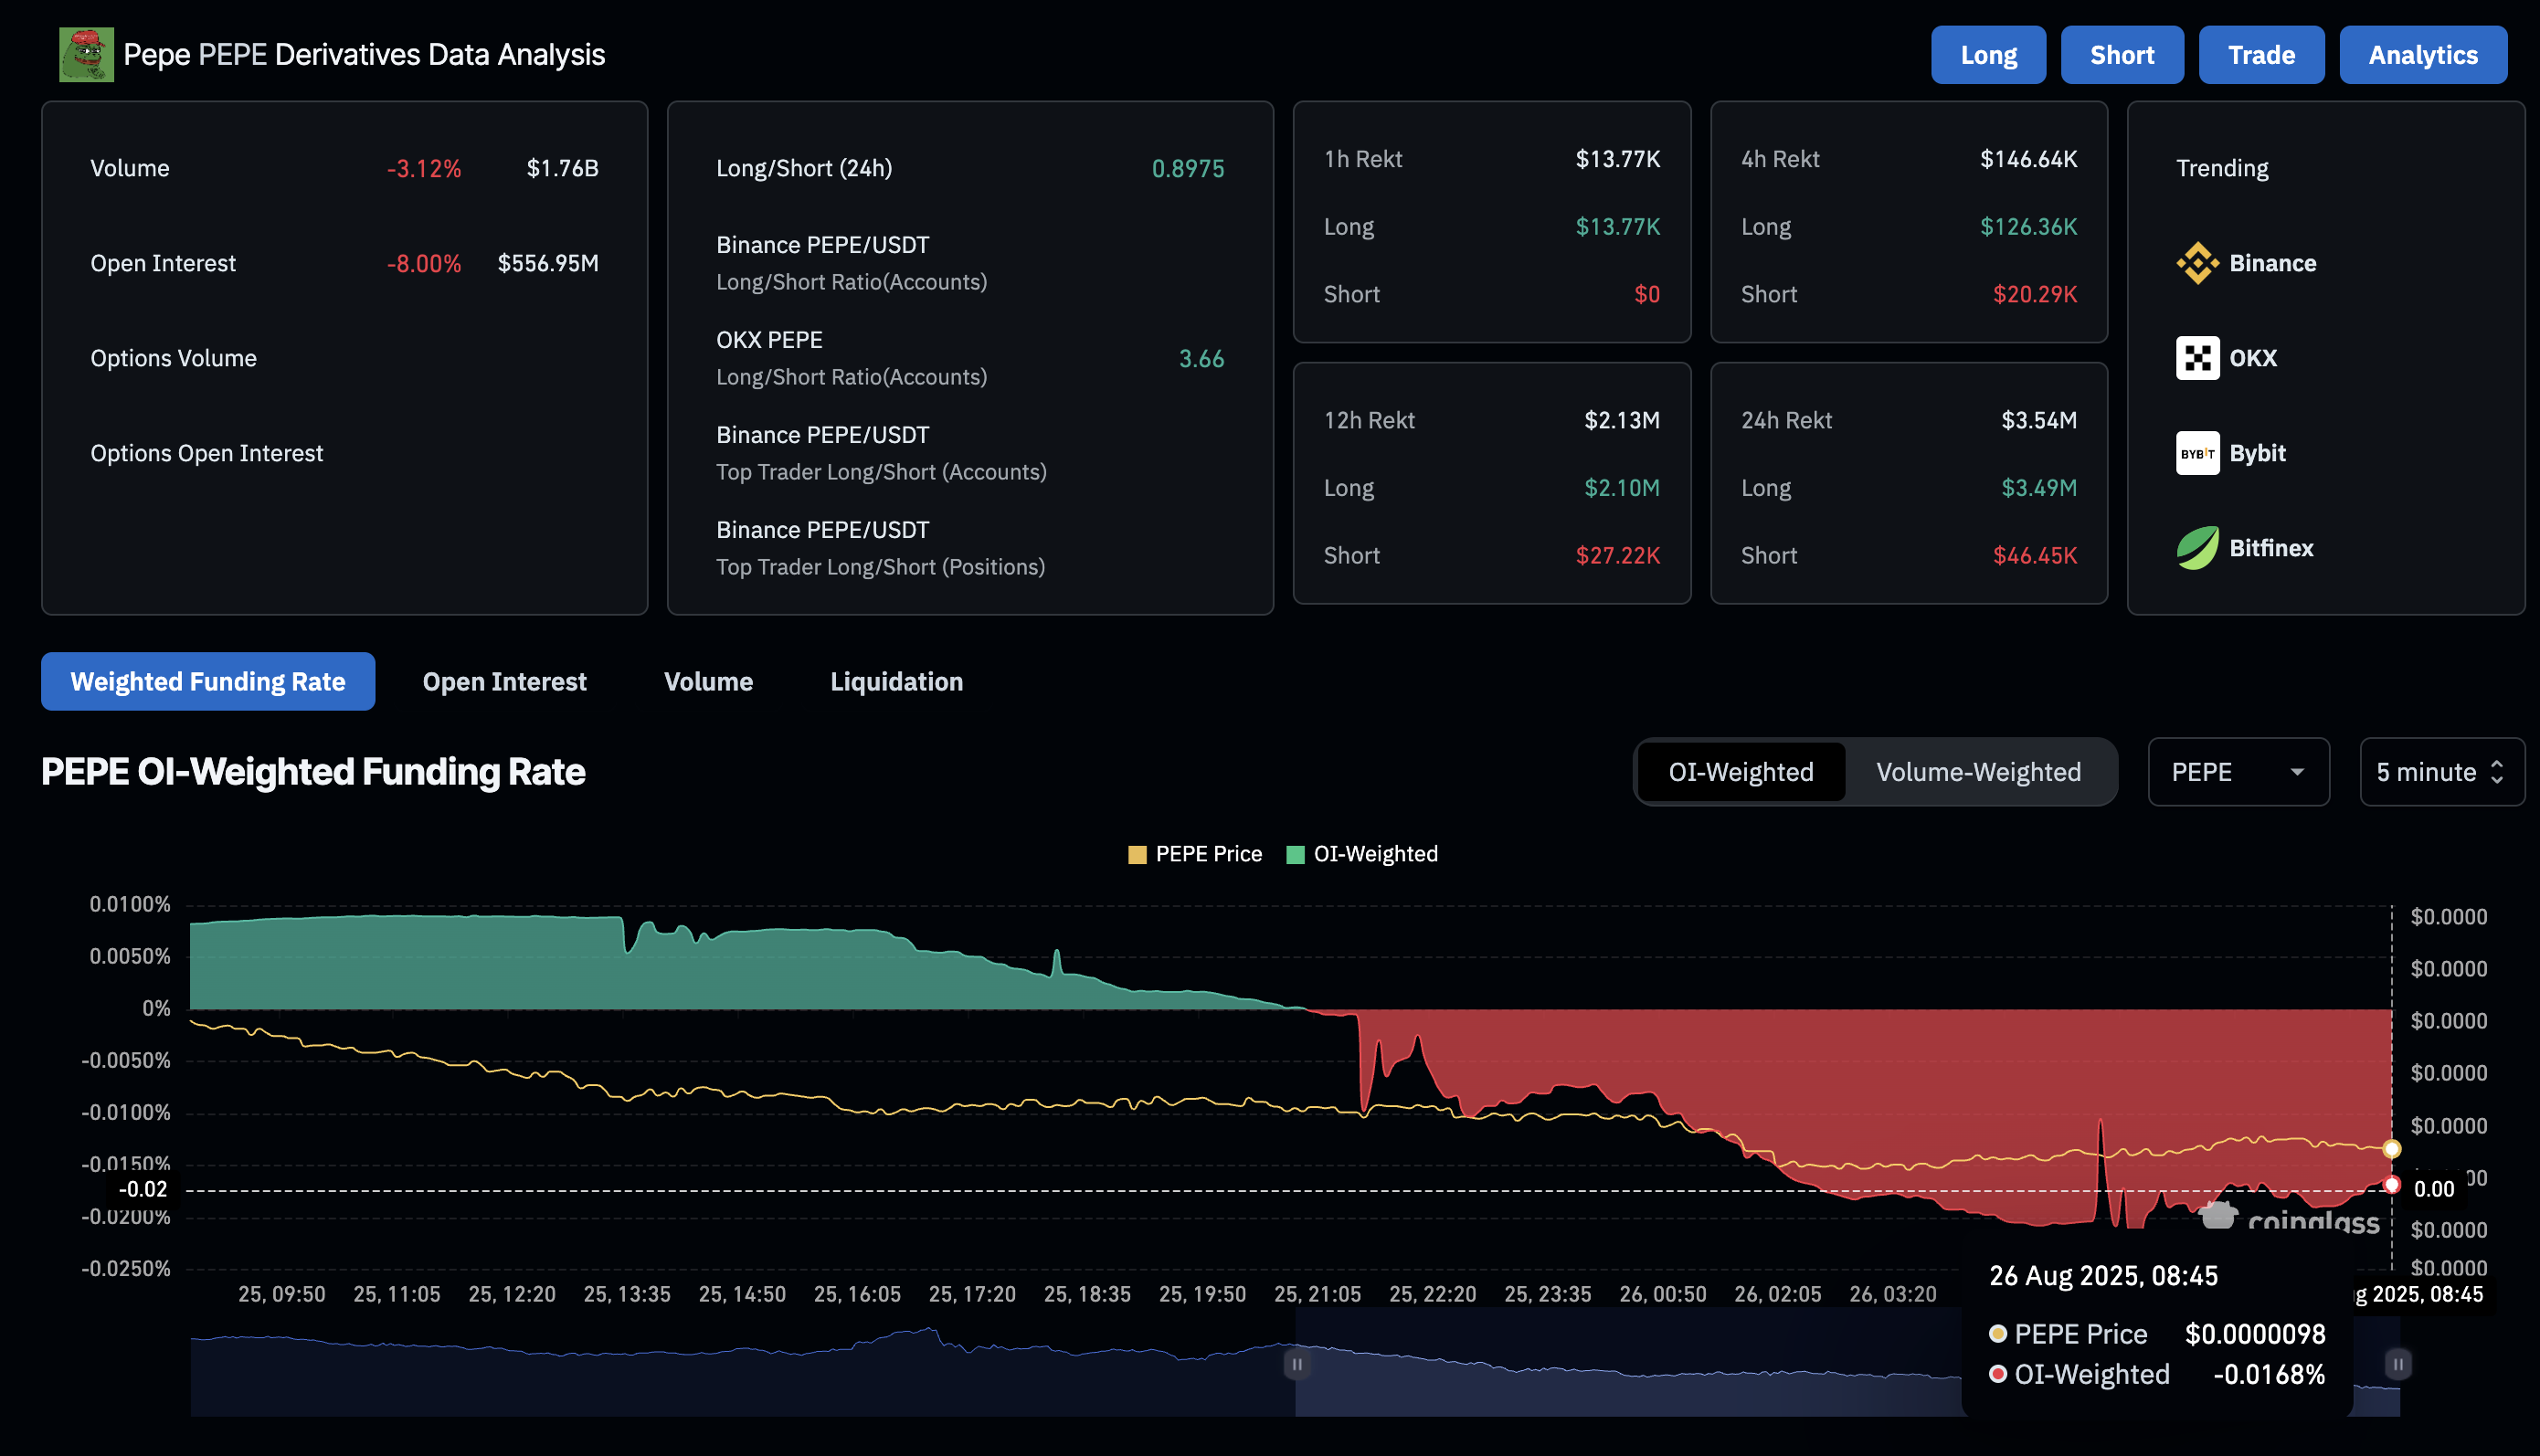
PEPE Open Interest. Source: CoinGlass
PEPE risks further losses to a crucial demand zone
PEPE recovers by 1% at press time on the day, after three consecutive days of losses, which peaked on Monday with a 9.88% decline. The frog-themed meme coin retested the $0.00000986 support-turned-resistance level.
The path of least resistance indicates an extension of the downtrend. A further decline in PEPE could test the $0.00000900 support zone, marked by the green band on the daily chart.
The possibility of death cross looms over PEPE's daily chart as the declining 50-day and 100-day Exponential Moving Averages (EMAs) move closer to the 200-day EMA.
Similarly, the momentum indicators on the daily chart hold a bearish bias. The Moving Average Convergence Divergence (MACD) and its signal line extend the declining trend in negative territory after a short-lived merger, reflecting resurfaced bearish momentum.
Furthermore, the Relative Strength Index (RSI) reads 40 on the same day, inching closer to the oversold zone as buying pressure wanes.
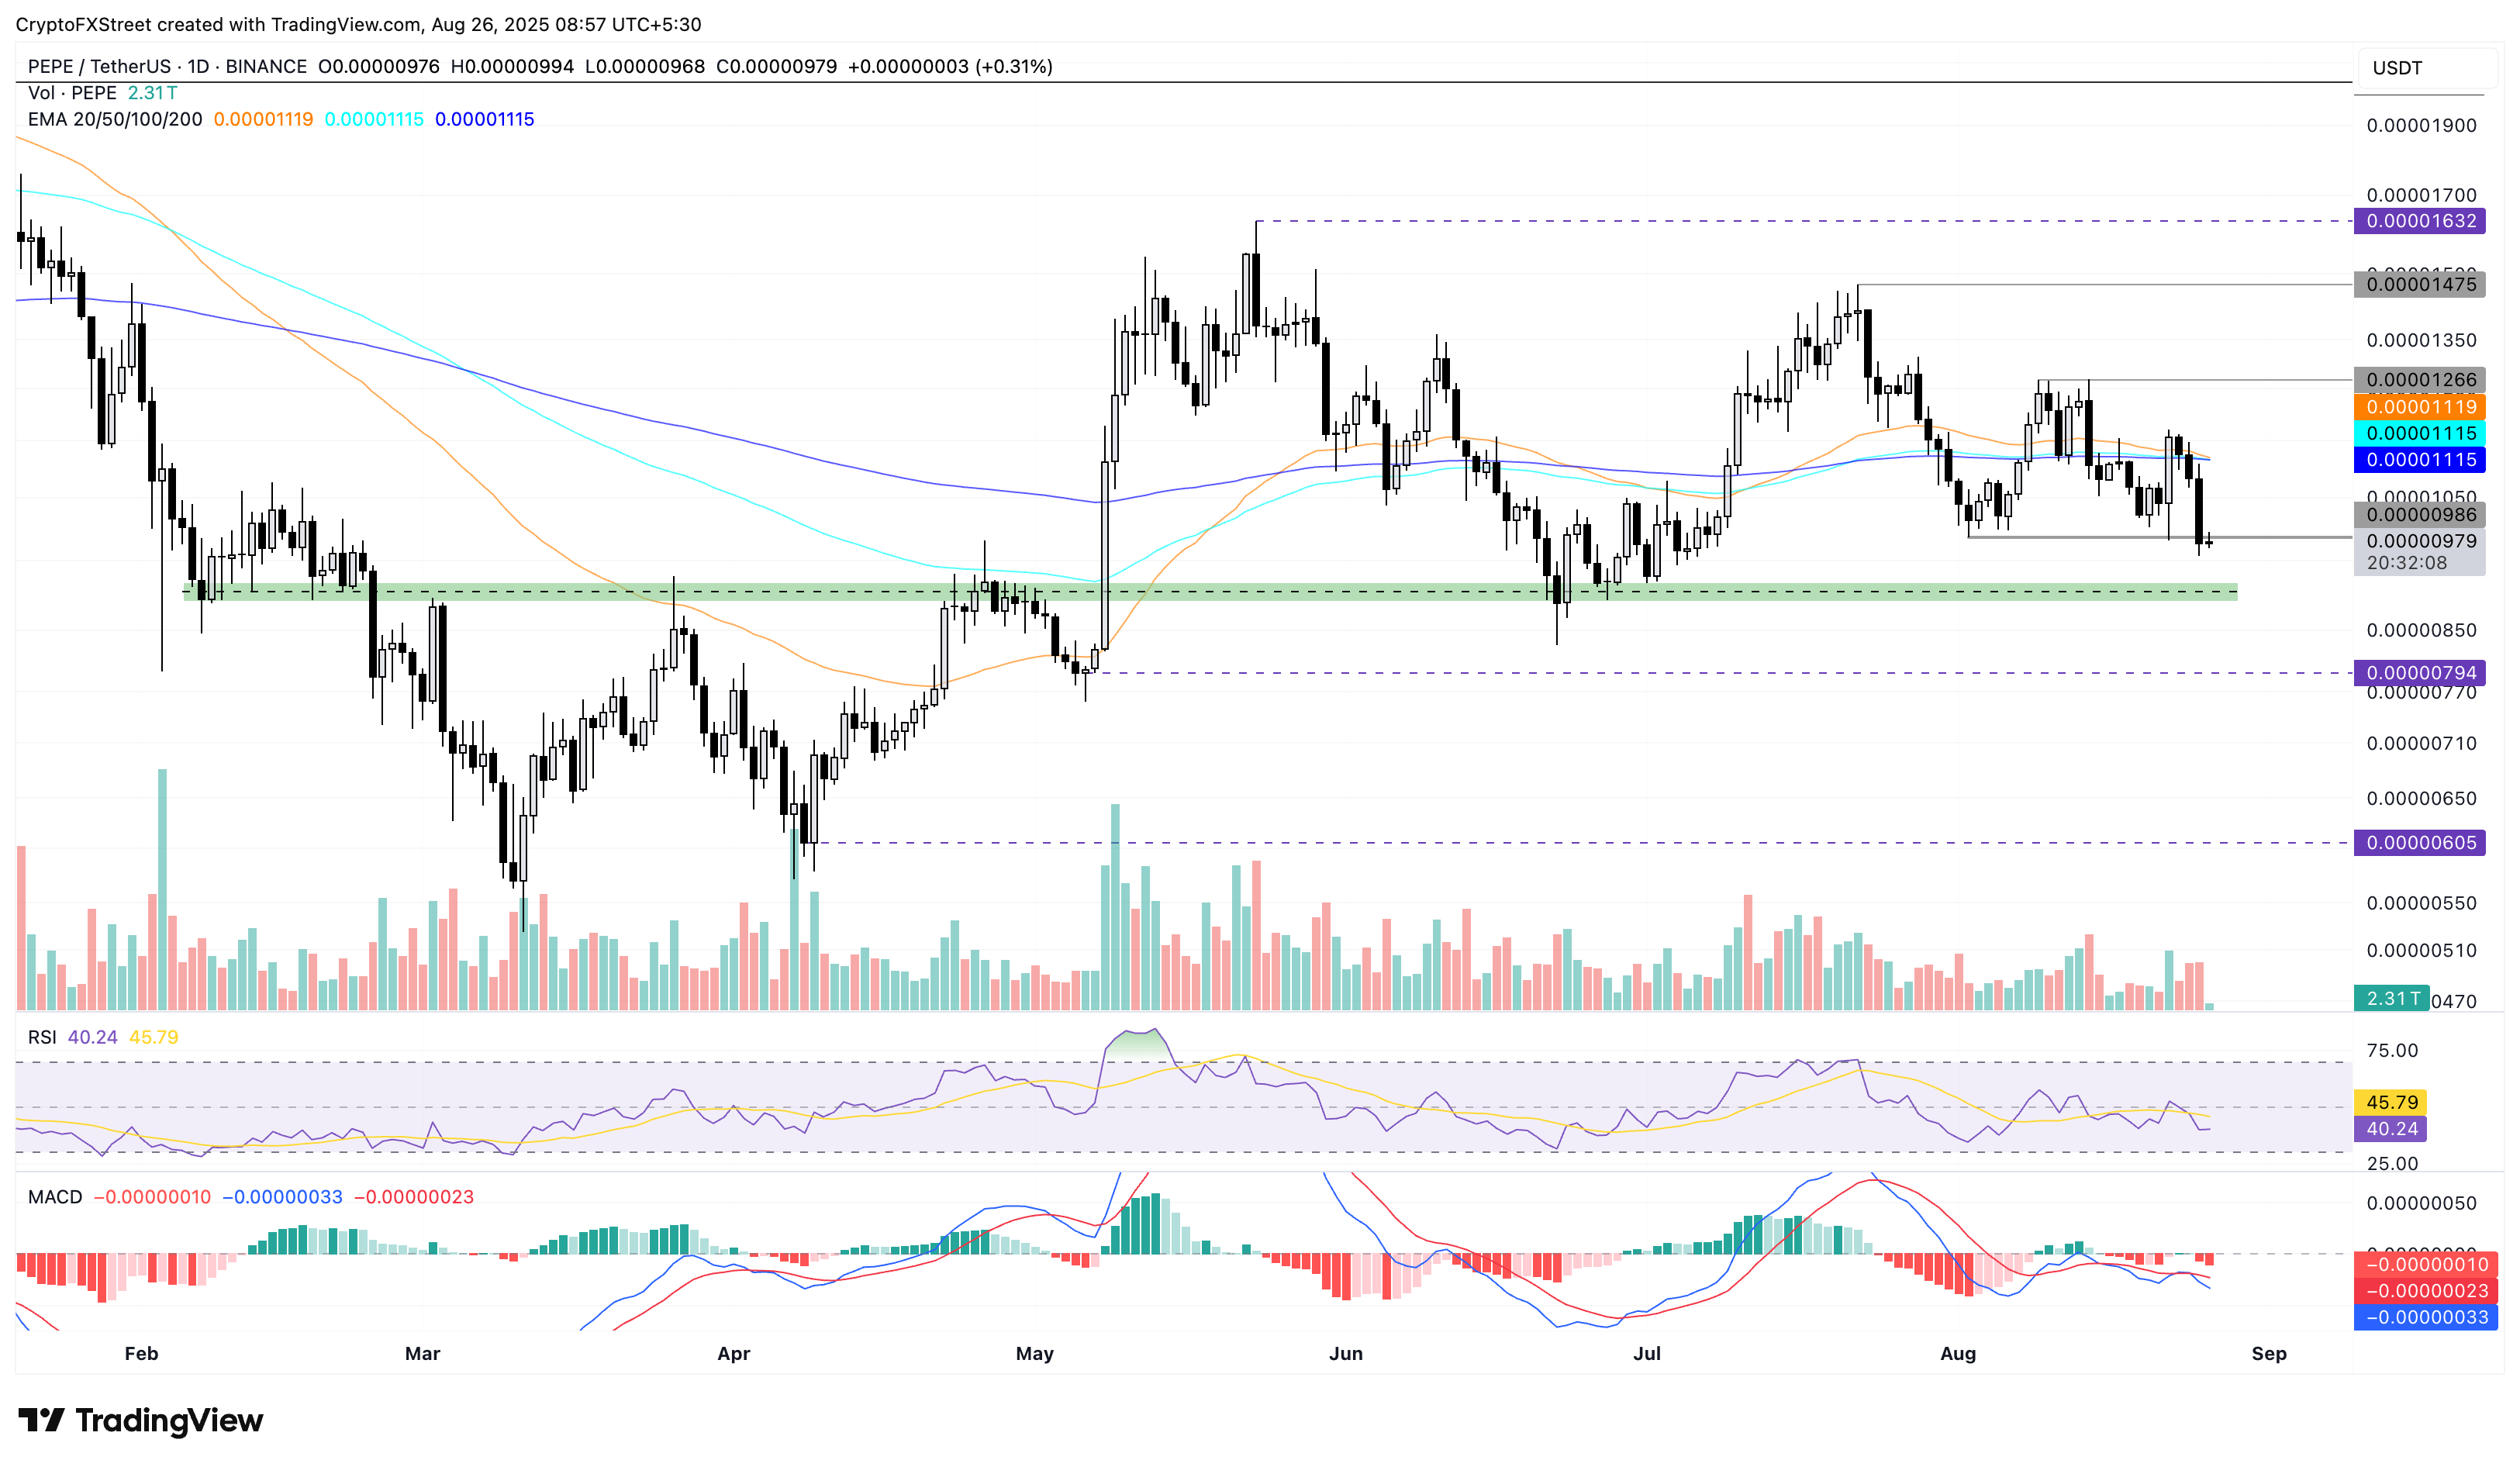
PEPE/USDT daily price chart
A revival in PEPE will require a decisive close above this level, which could potentially target the 200-day EMA at $0.00001115.
Recommended Articles


Comments (0)
Click the $ button, enter the symbol, and select to link a stock, ETF, or other ticker.