

Top Crypto Gainers: OKB, Sei, Bitcoin Cash – Altcoins shine through amid market volatility


- OKB edges higher after an 8% rise on Thursday, hinting at a trend reversal rally as it reclaims $50.
- Sei ticks higher for the third consecutive day, breaking out of a falling channel pattern.
- Bitcoin Cash outperformed Bitcoin with an 8% jump on Thursday, breaking above a critical resistance level.
The top cryptocurrencies in the market remain quiet at crucial support levels, while some altcoins experience a bullish spark. Top performers over the last 24 hours include OKB (OKB), Sei (SEI), and Bitcoin Cash (BCH) with over 8% recovery and key resistance breakouts.
OKB’s bullish reversal gains momentum
OKB trades in the green by over 3% at press time on Friday following the 8.92% rise the previous day. With two consecutive bullish engulfing candles, OKB reclaims the $50 psychological mark and surpasses the $53 peak, the highest monthly closing.
A decisive new higher monthly closing could further propagate OKB’s uptrend towards $56, last tested on May 10. Beyond this, the $58 level stands as a resistance, marked by the highest year-to-date closing price.
The uptick in Moving Average Convergence/Divergence (MACD) indicator crosses above its signal line on the daily chart, triggering a bullish crossover. With a new green histogram bar rising from the zero line, the indicator signals a boost in bullish momentum.
The Relative Strength Index (RSI) at 60 approaches the overbought boundary, signaling a surge in buying pressure.
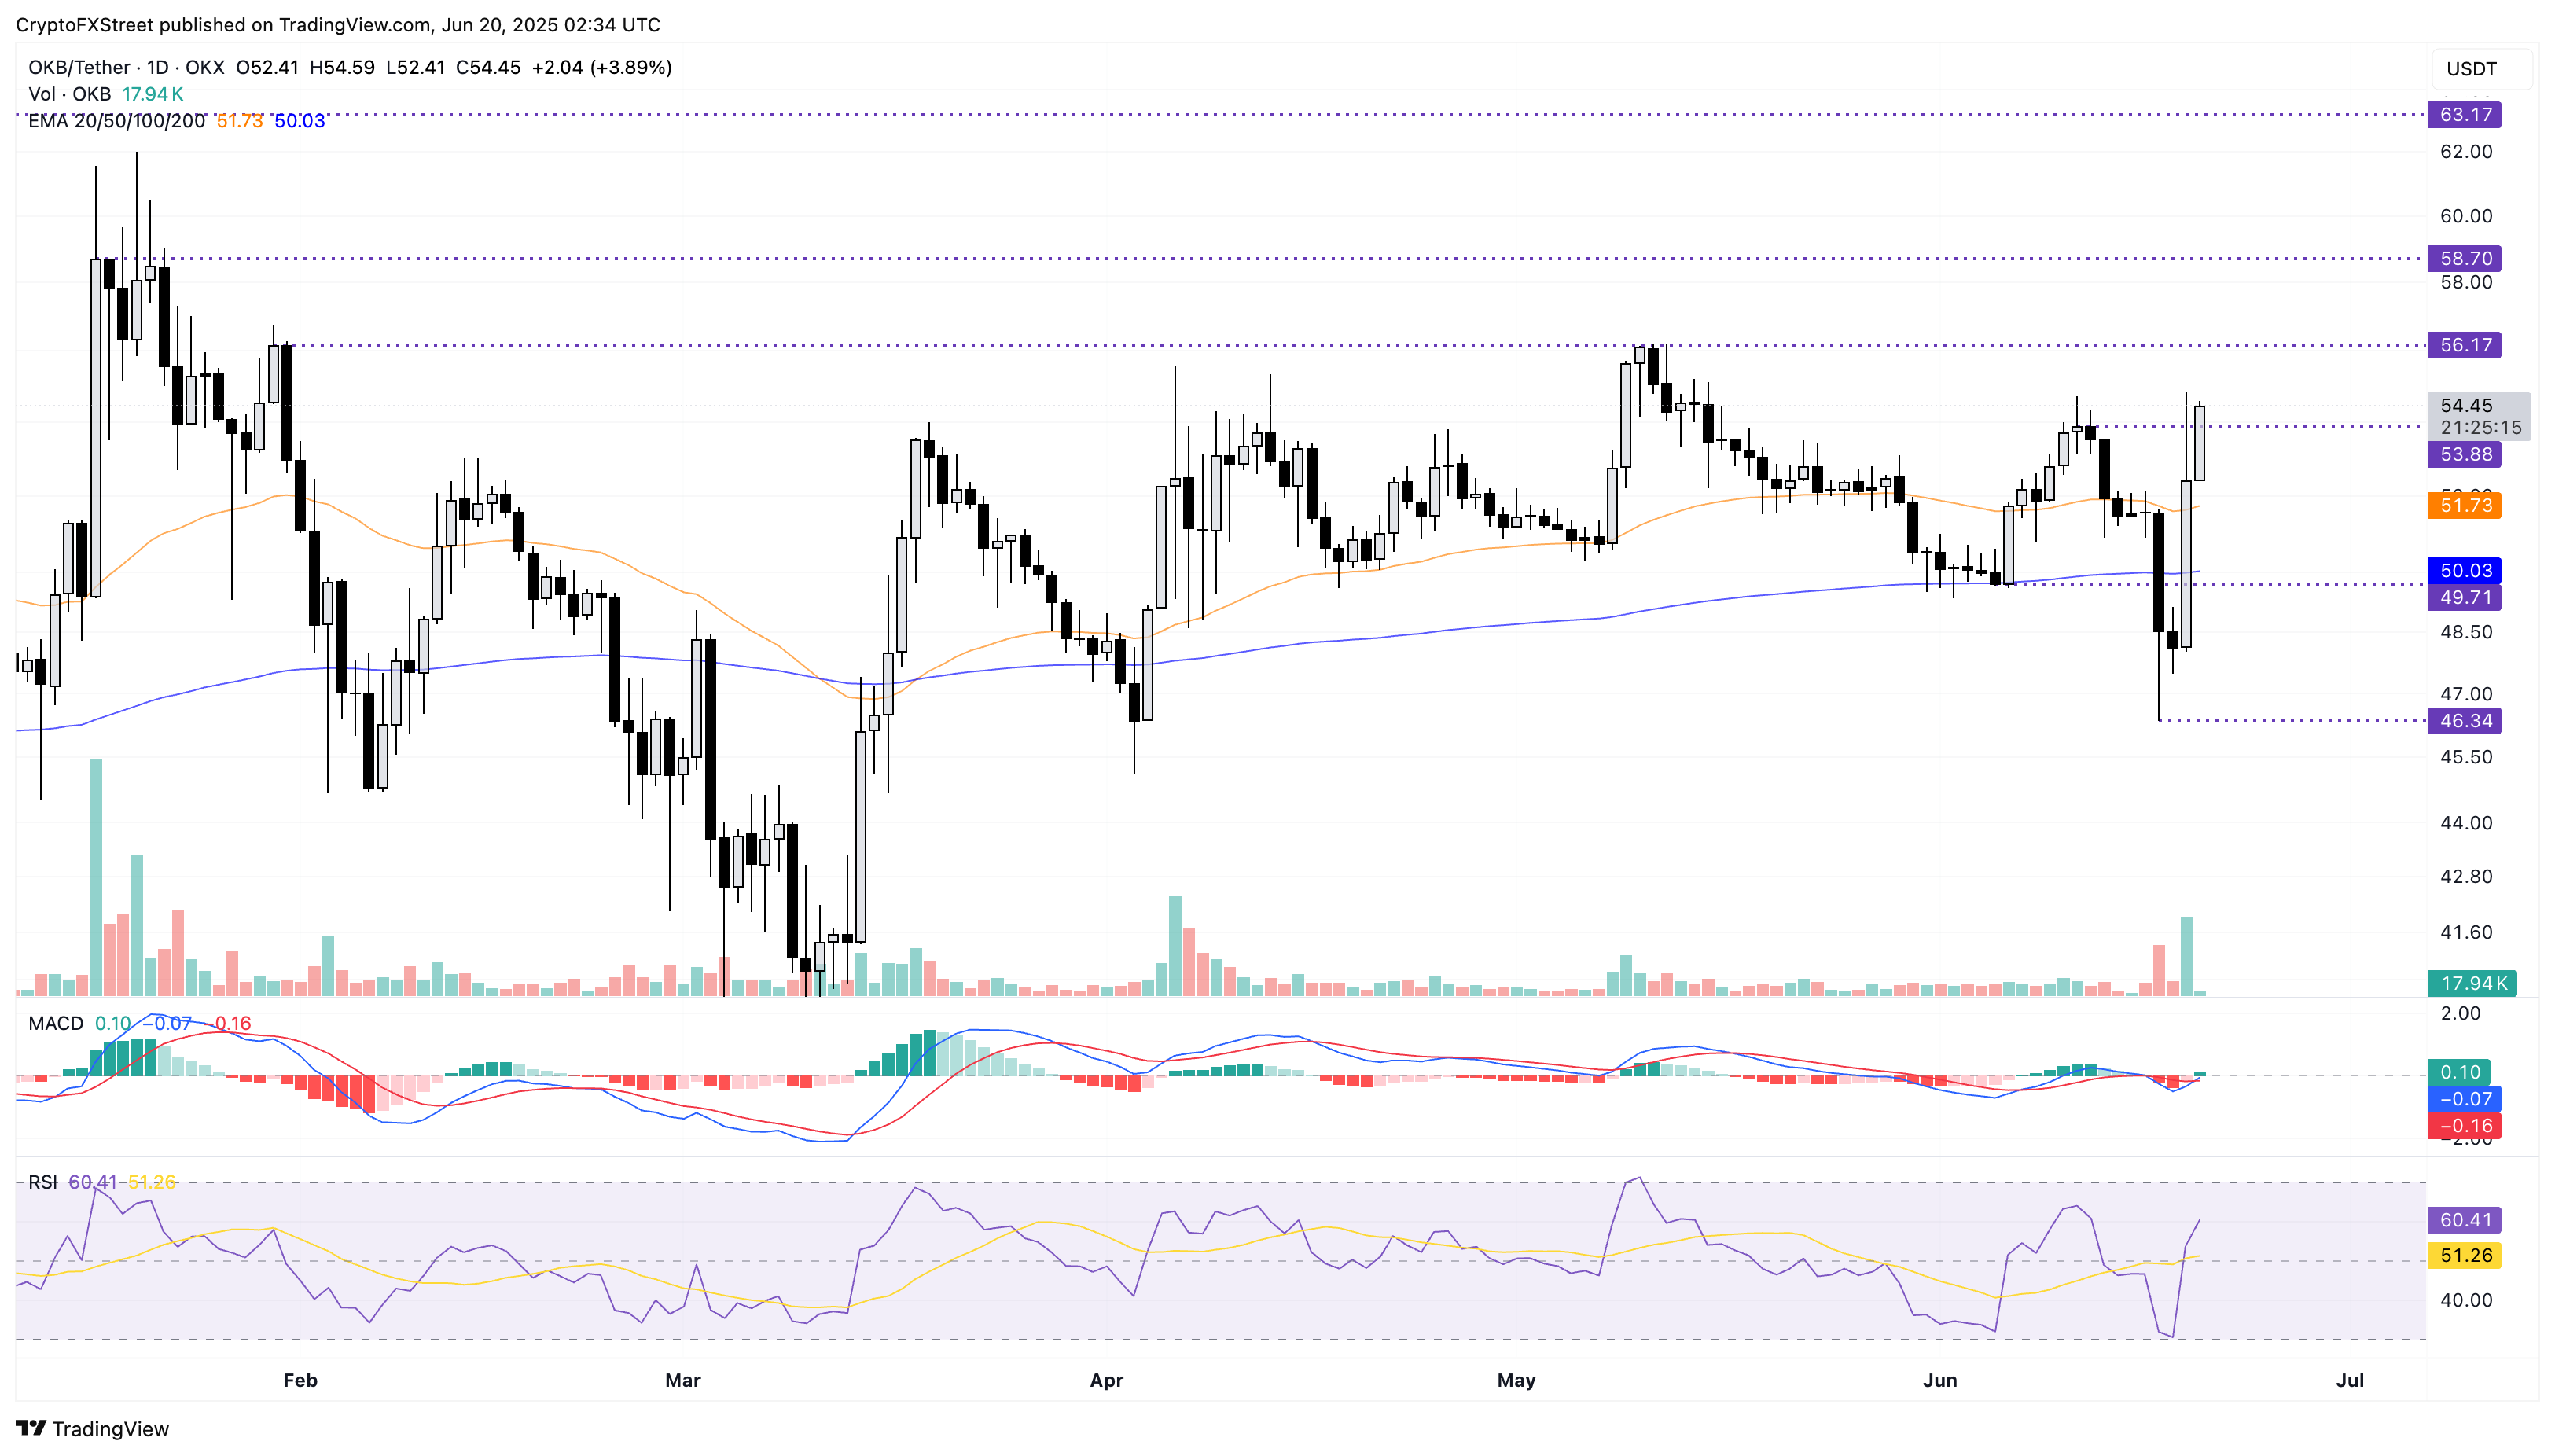
OKB/USDT daily price chart.
If OKB fails to hold above $53, a reversal could retest the $50 psychological level, followed by the $46 low formed on Tuesday.
SEI outgrows a falling channel
SEI prints its third consecutive bullish candle as it nears the $0.20 mark. At the time of writing, SEI edges higher by over 2% at press time on Friday, crossing a resistance trendline formed by declining peaks on May 11, May 23, May 29 and June 11.
A parallel support trendline formed by declining swing lows on May 31, June 5 and June 17 formed a channel with the overhead resistance trendline. A positive closing price on Friday will mark a decisive breakout of the channel, which could prolong the uptrend to $0.2334, the May 23 peak.
The MACD indicator flashes a buy signal with a bullish crossover with its signal line. The RSI at 52 edges above the halfway level, flashing a boost in bullish momentum.
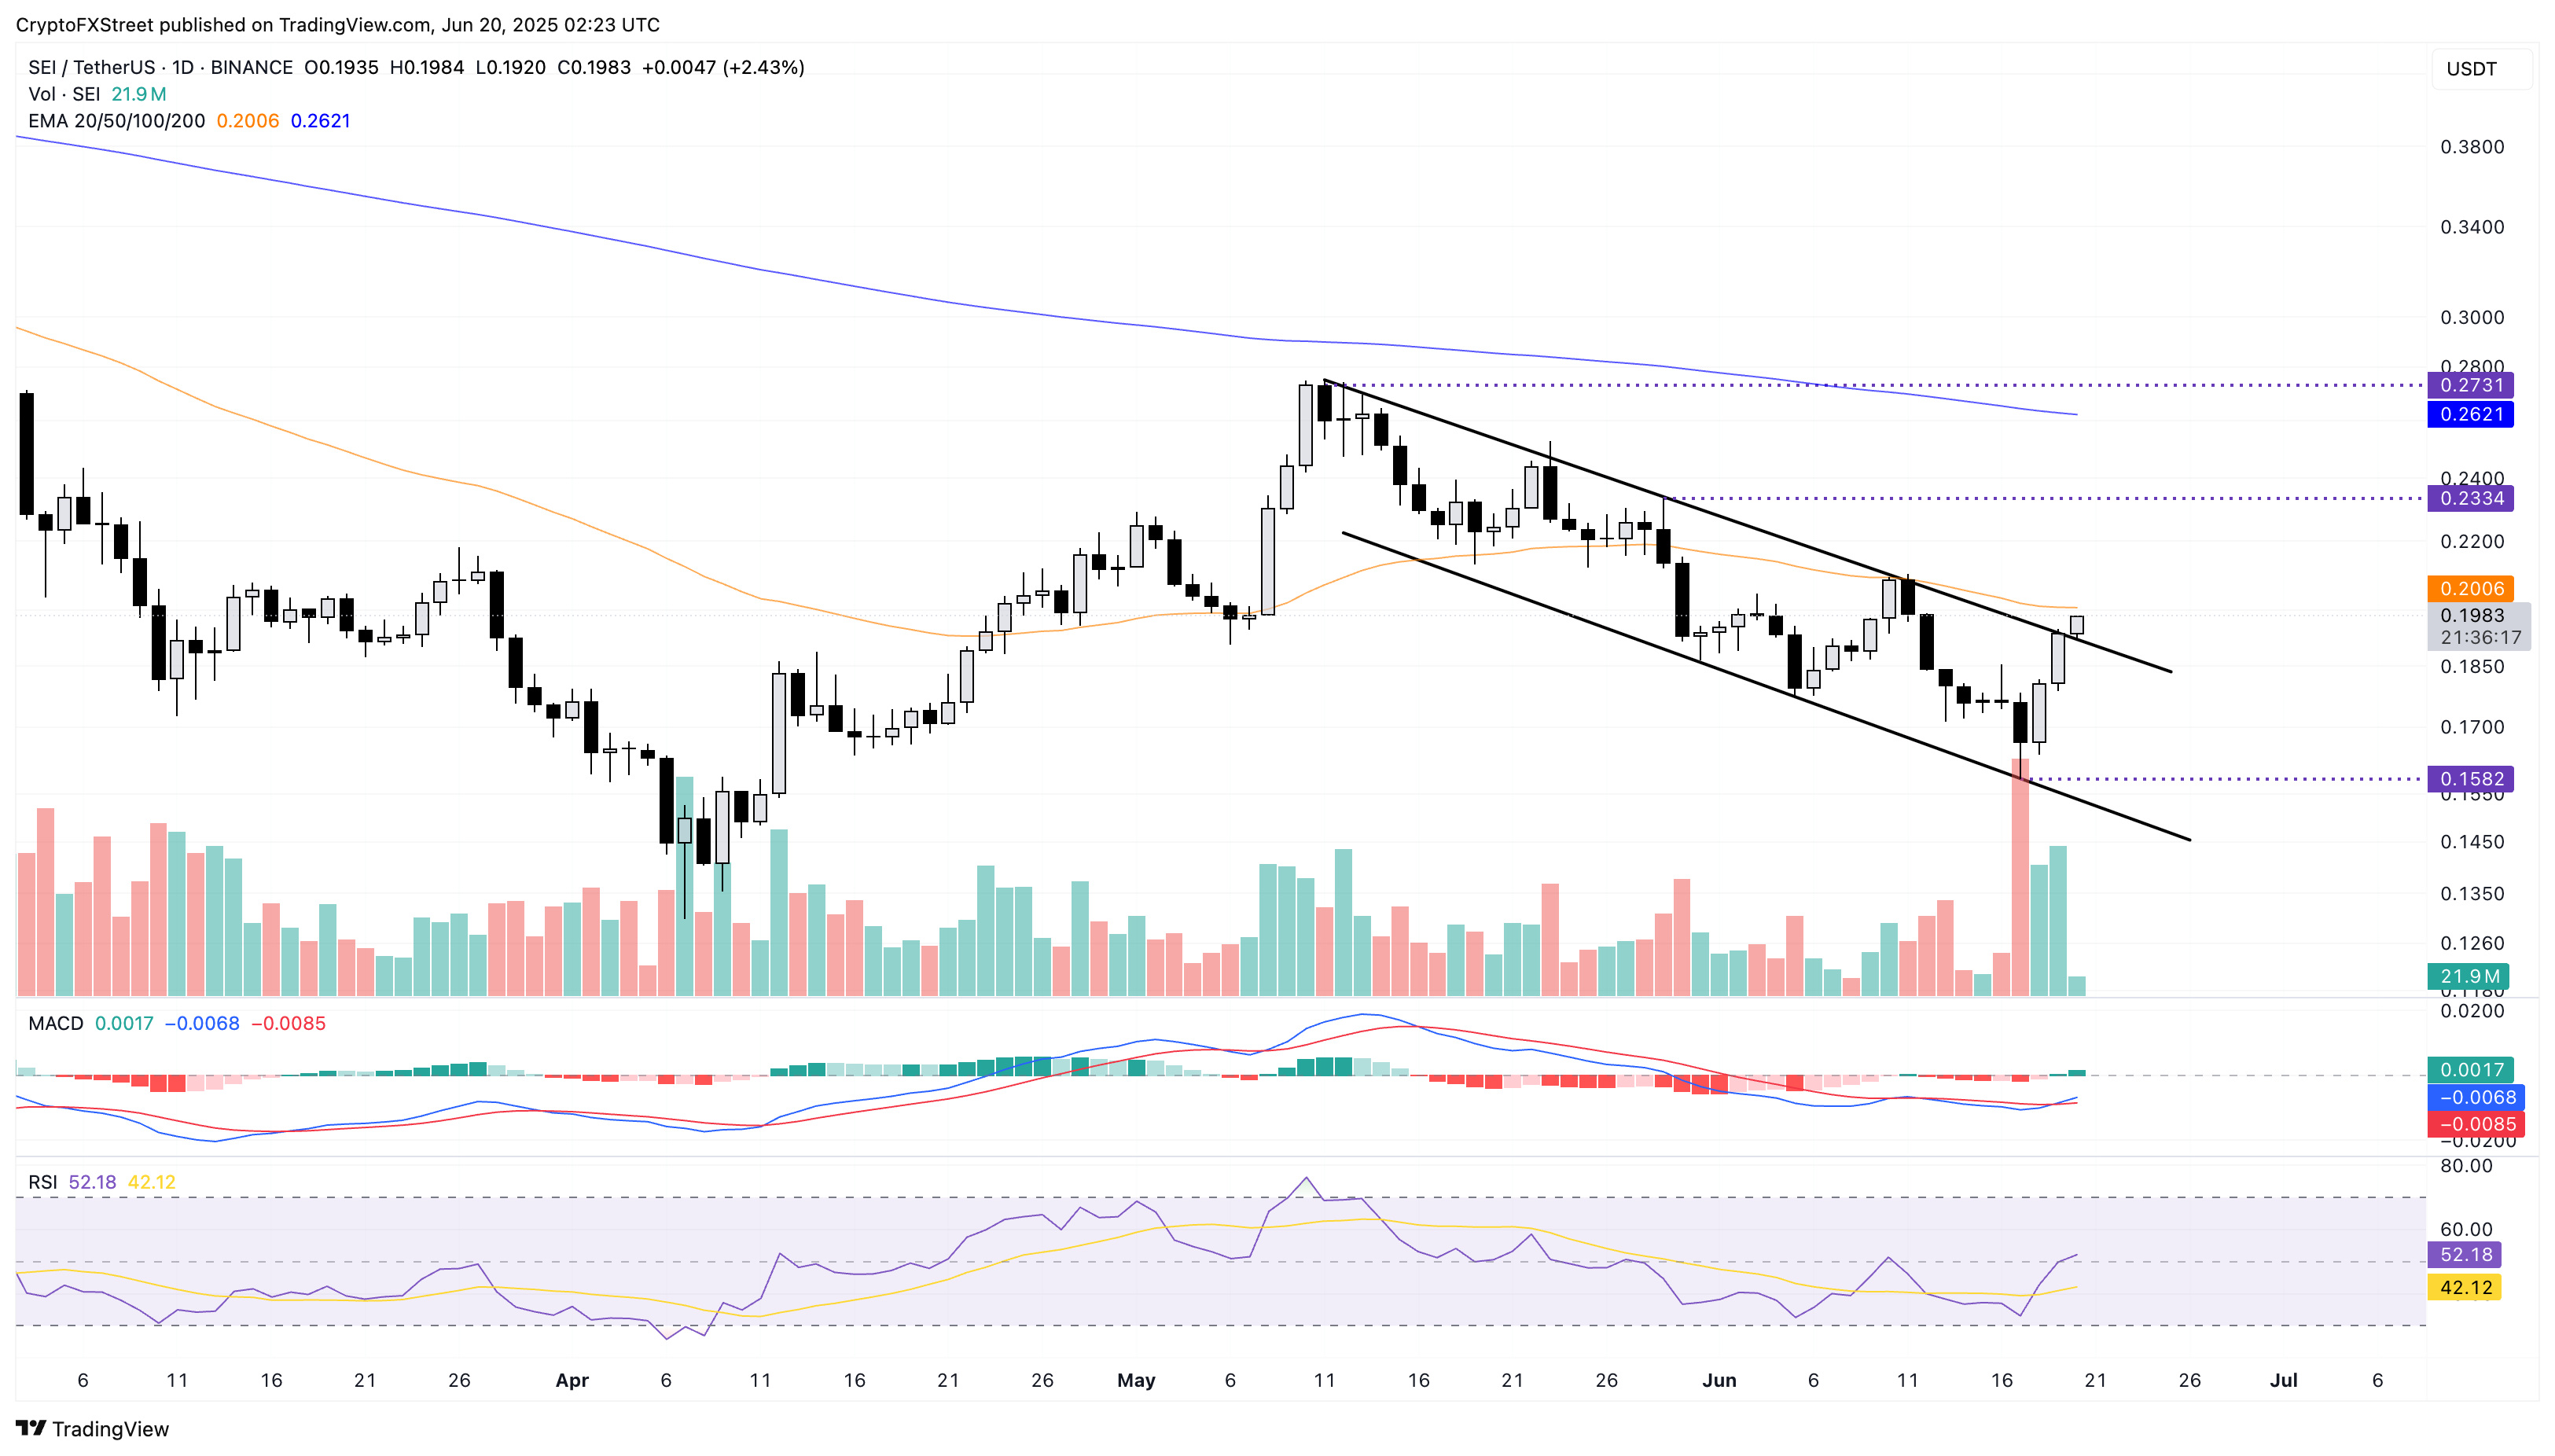
SEI/USDT daily price chart.
If SEI records a negative closing on Friday, it could extend the downtrend within the falling channel towards the weekly low at $0.1582.
Bitcoin Cash nears $500 breakout
Bitcoin Cash maintains its 8% gains from Thursday, trading at $496 at the time of press. BCH nears the $500 psychological level breakout after crossing the 61.8% Fibonacci level at $490, drawn from the 52-week high at $640 to the year-to-date low at $249.
A closing above $500 could prolong the BCH uptrend towards the $556, aligning with the 78.6% Fibonacci level.
The uptrend in the MACD indicator and its signal catalyzes a bullish growth of histogram bars from the zero line, suggesting a surge in buying pressure. The RSI at 70 signals strong bullish momentum, while overbought conditions risk surges that could result in an abrupt pullback.
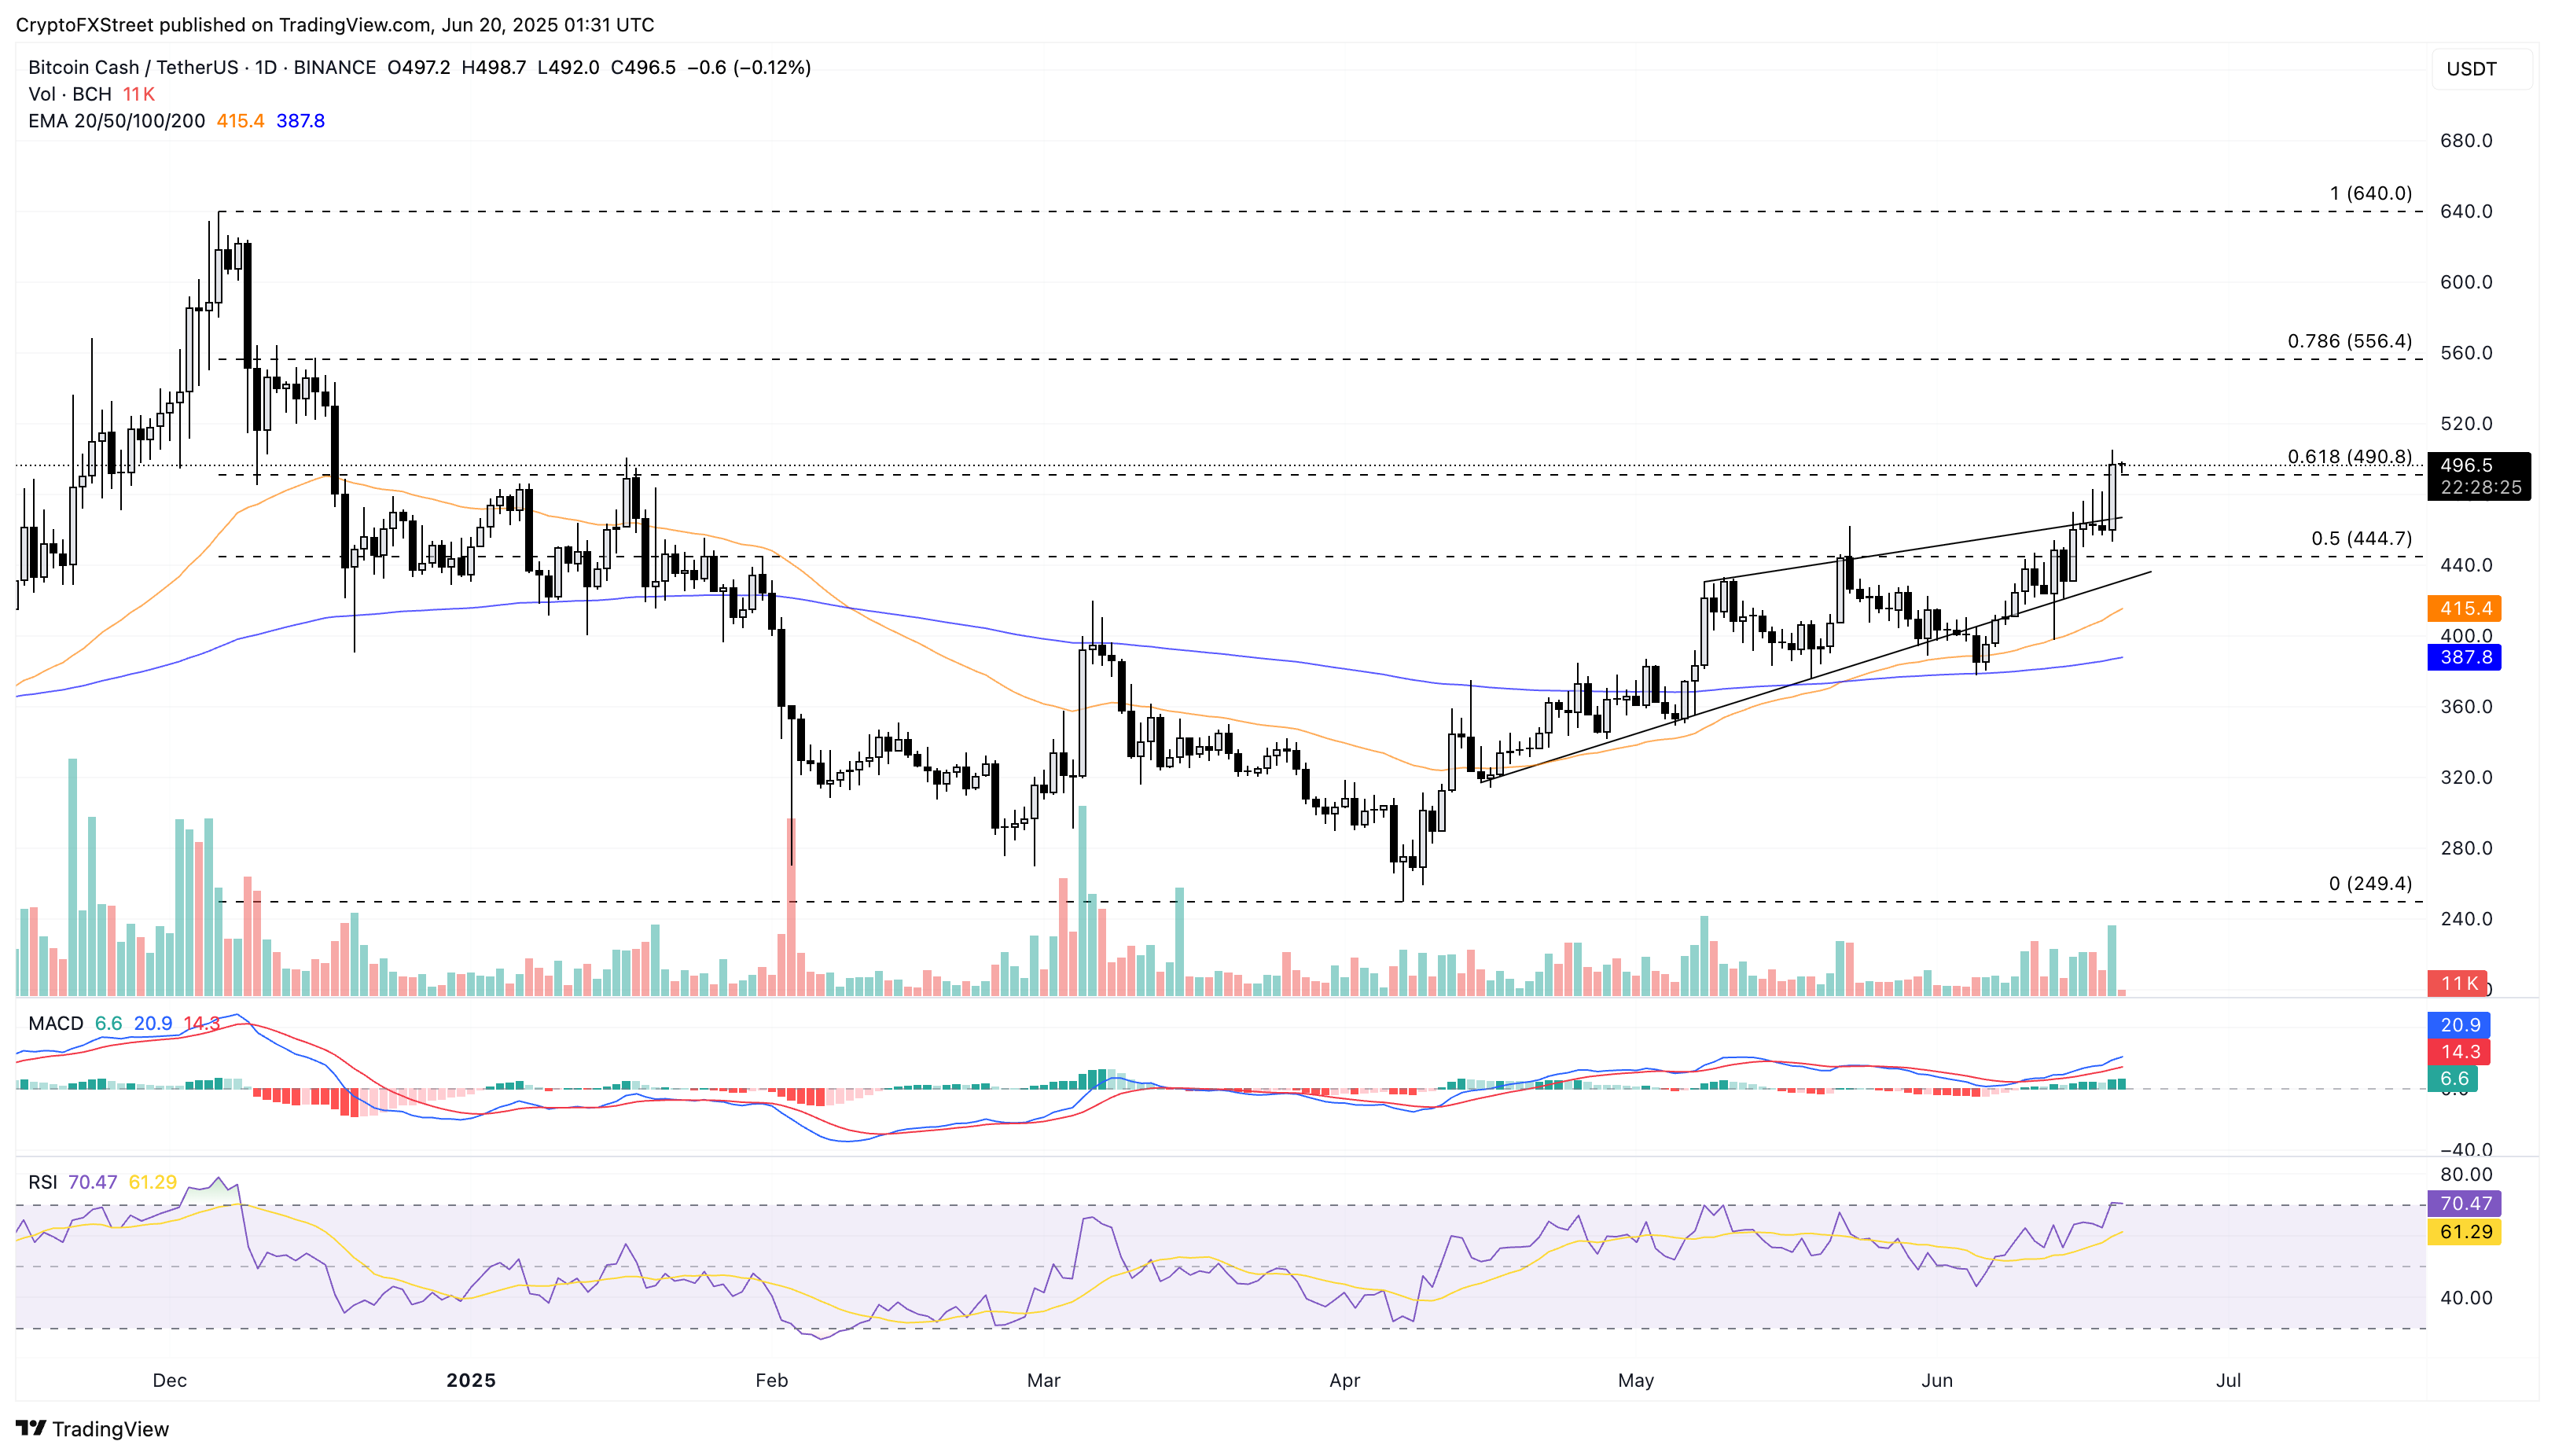
BCH/USDT daily price chart.
A negative daily closing below the 61.8% Fibonacci level could extend Bitcoin Cash’s decline towards $444, aligned with the 50% Fibonacci level.
Recommended Articles


Comments (0)
Click the $ button, enter the symbol, and select to link a stock, ETF, or other ticker.