

BNB Price Gears Up for Upside Break — Will Bulls Deliver?


BNB price is gaining pace above the $650 support zone. The price is now showing positive signs and might aim for more gains in the near term.
- BNB price is attempting to recover from the $620 support zone.
- The price is now trading above $655 and the 100-hourly simple moving average.
- There is a key contracting triangle forming with resistance at $662 on the hourly chart of the BNB/USD pair (data source from Binance).
- The pair must stay above the $655 level to start another increase in the near term.
BNB Price Eyes More Gains
After forming a base above the $620 level, BNB price started a fresh increase. There was a move above the $645 and $650 resistance levels, like Ethereum and Bitcoin.
The price even surged above the $660 level. A high was formed at $666 before there was a downside correction. The price dipped below the 50% Fib retracement level of the upward move from the $650 swing low to the $666 swing high.
The price is now trading above $655 and the 100-hourly simple moving average. On the upside, the price could face resistance near the $662 level. There is also a key contracting triangle forming with resistance at $662 on the hourly chart of the BNB/USD pair.
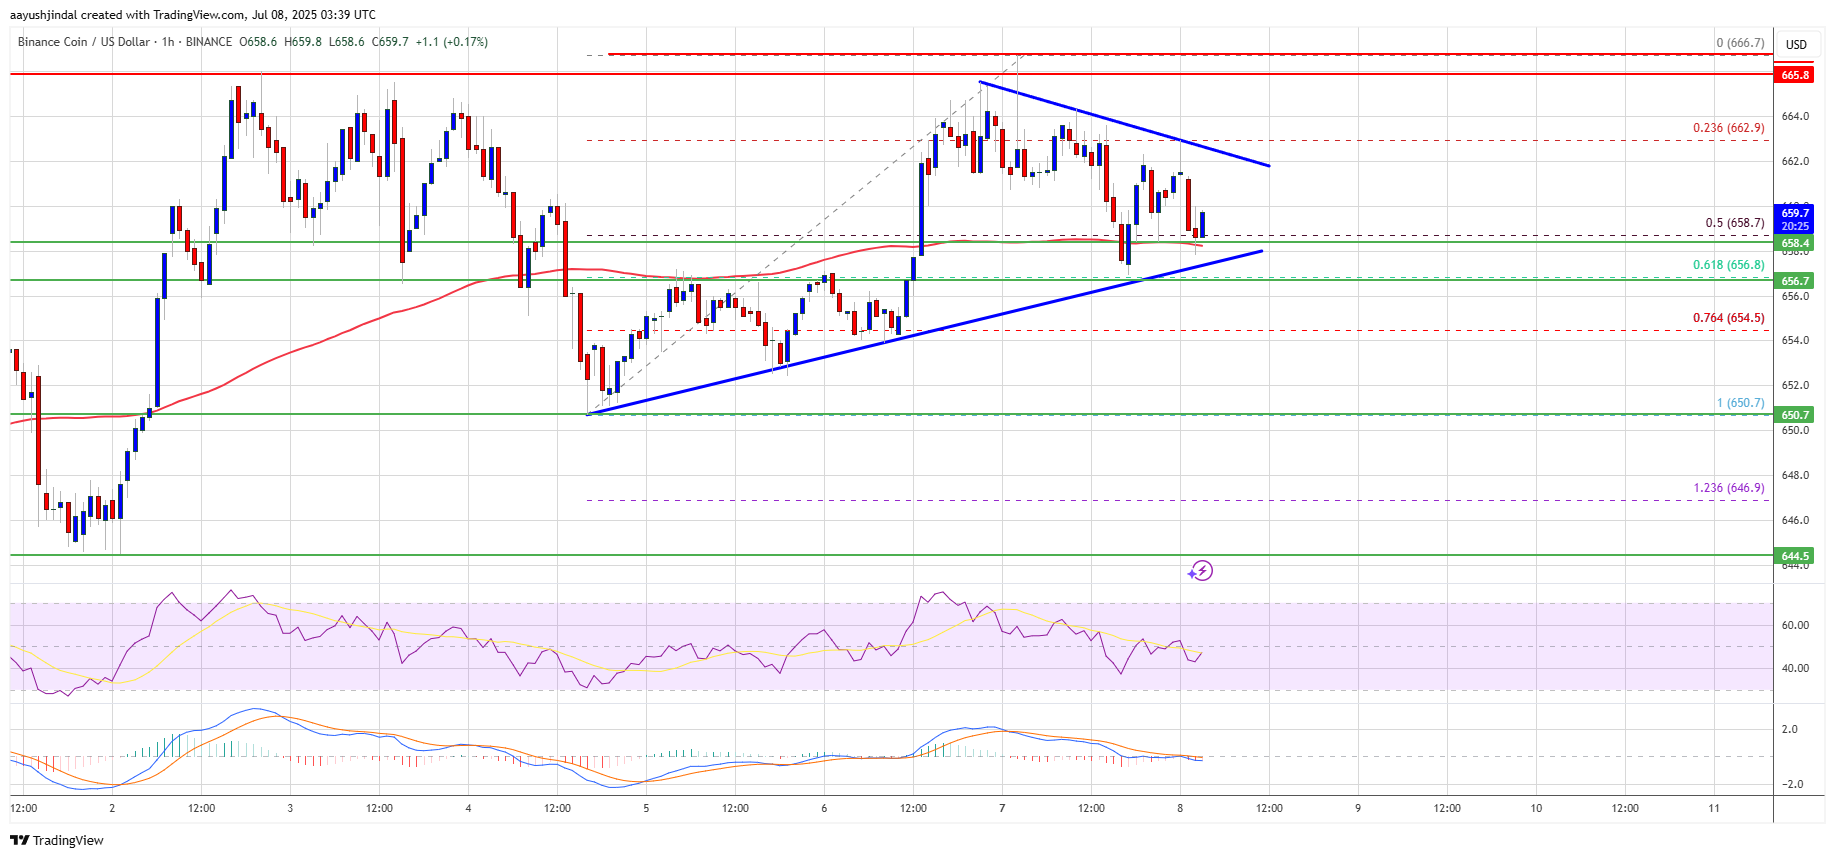
The next resistance sits near the $665 level. A clear move above the $665 zone could send the price higher. In the stated case, BNB price could test $672. A close above the $672 resistance might set the pace for a larger move toward the $680 resistance. Any more gains might call for a test of the $700 level in the near term.
Another Decline?
If BNB fails to clear the $662 resistance, it could start another decline. Initial support on the downside is near the $655 level and the 61.8% Fib retracement level of the upward move from the $650 swing low to the $666 swing high. The next major support is near the $650 level.
The main support sits at $644. If there is a downside break below the $644 support, the price could drop toward the $632 support. Any more losses could initiate a larger decline toward the $620 level.
Technical Indicators
Hourly MACD – The MACD for BNB/USD is gaining pace in the bullish zone.
Hourly RSI (Relative Strength Index) – The RSI for BNB/USD is currently above the 50 level.
Major Support Levels – $655 and $650.
Major Resistance Levels – $662 and $665.
Recommended Articles


Comments (0)
Click the $ button, enter the symbol, and select to link a stock, ETF, or other ticker.