


Gold Price Forecast: Gold Rebounds Nearly 2% After Falling Below $3,900; Has a Short-Term Bottom Formed?



AI Podcast


During the Asian session on Tuesday (November 3), gold prices hovered near $3,955 following a sharp rebound from a one-year low. The recent surge was driven by falling oil prices, which eased inflation pressures and cooled expectations for a December Federal Reserve rate hike, alongside a softer U.S. dollar. However, sticky inflation, strong manufacturing data, and lingering rate-hike probabilities continue to weigh on the outlook. Technically, despite recovering from oversold conditions, gold remains capped below key moving averages and crucial resistance, with downside risks pointing toward support at $3,850 and $3,560 if current rebound momentum fails.

TradingKey - As of the Asian session on Tuesday (November 3), gold prices (XAUUSD) hovered at high levels following a sharp rebound in the previous trading session, with the latest price trading near $3,955, up slightly by about 0.25% on the day. Earlier, gold prices dropped to around $3,870 on October 30, hitting a one-year low, before surging over 2% on November 2. A sharp pullback in oil prices eased market concerns over U.S. inflation; however, the probability of a Fed rate hike in December remains high, and gold's short-term outlook continues to face tests.
Oil Price Slump Eases Inflation Pressure, Cooling Fed Rate Hike Expectations
On November 2, as Iran and Qatar held talks for a third consecutive day aimed at ending the Middle East conflict, market expectations for a recovery in regional crude oil supply mounted, sending Brent (UKOIL) crude down 8.01% on the day. The sharp pullback in oil prices helped ease inflationary pressures stemming from rising energy costs, thereby reducing market concerns about further monetary tightening by the Federal Reserve. Meanwhile, the US dollar weakened slightly, providing support for a rebound in gold prices.
Previously, US September PCE data showed that headline PCE rose 3.6% year-over-year, up from 3.4% in August, while core PCE rose 3.1% year-over-year, indicating that US inflation remained significantly above the Federal Reserve's 2% target. The Fed kept interest rates unchanged at its October meeting, but has yet to clearly signal an end to its rate-hiking cycle.
However, as international oil prices pulled back, market expectations for another rate hike in December cooled somewhat. According to the CME FedWatch Tool, the probability of a Fed rate hike in December fell to 73% from about 81.6% a week earlier. Although the adjustment was modest, it still helped relieve the pressure that recent expectations of high interest rates had exerted on gold.
In addition, the latest US October ISM Manufacturing PMI rose to 55.5 from 54.5 in September, beating market expectations and indicating continued expansion in manufacturing activity. However, although the Manufacturing Prices Paid Index fell from 77.9 to 75.2, it remained at a high level, showing that cost pressures facing US businesses have not fully subsided.
Notably, gold's sharp decline last Friday was also affected by shifts in financial market liquidity. As US tech stocks and AI-related equities faced a sell-off, some investors sold highly liquid assets such as gold to meet margin calls, amplifying the short-term drop in gold prices.
Overall, falling oil prices and a weaker US dollar have improved the short-term trading environment for gold, but US inflation remains high, and expectations of a December rate hike have not entirely vanished. If oil prices continue to fall in the future and drive down the US dollar and US Treasury yields, the rebound in gold could gain further support; conversely, if inflationary pressures heat up again, gold prices may still face a correction.
Gold Price Technical Analysis
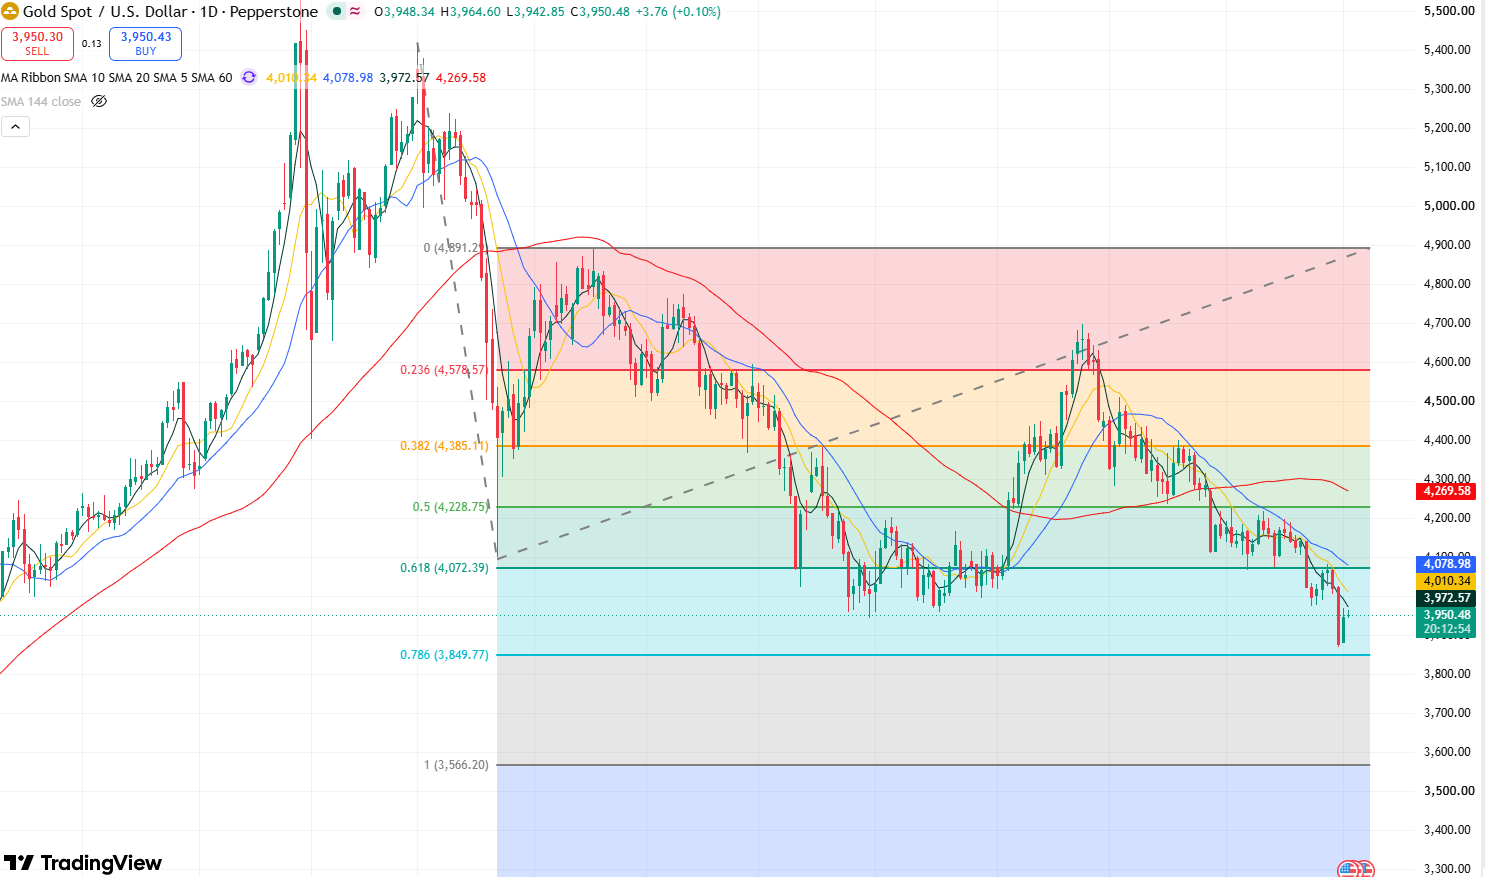
Gold price daily chart, Source: TradingView
Based on gold's daily chart, gold prices fell sharply last Friday, at one point breaking below two key support levels at $3,975 and $3,940, which significantly increased market selling pressure and further pushed prices below the $3,900 mark. Although gold rebounded quickly on Monday driven by a sharp plunge in oil prices and reclaimed the $3,900 level, it remains capped by the 5-day moving average, meaning the short-term rally is not yet sufficient to confirm that the previous downtrend has ended.
In terms of technical indicators, the Relative Strength Index (RSI) recovered from below 30 last Friday to around 37, indicating that the previous oversold conditions have eased, but it remains below the 50 midline, reflecting that the current rebound momentum has not yet fully strengthened.
Currently, as gold has broken below the key support level of $3,940, further downside room in its overall structure has been opened up, and prices may continue to fall in the short term. The primary downside target will be testing the support level at $3,850. If this level fails to hold, gold may further retreat toward the 1.0 Fibonacci retracement level near $3,560.
On the upside, for gold to open up further space for a rebound, it first needs to firmly reclaim above $3,970 before it can be expected to test the resistance level at $4,026. If gold breaks and holds above this level, it may move up to test resistance near $4,080.
This content was translated using AI and reviewed for clarity. It is for informational purposes only.
Recommended Articles











Comments (0)
Click the $ button, enter the symbol, and select to link a stock, ETF, or other ticker.