

Commodities Face Broad Selloff: Gold Falls Below 4,000 Mark, Silver Tumbles 5%, Both Crudes Drop Over 4%


AI Podcast
On June 24, Eastern Time, global commodity markets experienced a broad sell-off. Spot gold fell 2.87% to $3,992.80, while silver plummeted 4.64%. Crude oil also retreated significantly, with WTI and Brent dropping over 4%. The decline was driven by reduced geopolitical tensions following diplomatic progress between the U.S. and Iran, and intensified expectations for Federal Reserve rate hikes amid persistent U.S. inflation. Consequently, the strengthening dollar and increased market volatility dampened investor appetite for non-yielding assets. Major financial institutions, including Goldman Sachs and Deutsche Bank, have subsequently revised their gold price targets downward, citing ongoing monetary tightening risks.
TradingKey - On June 24, Eastern Time, global commodity markets suffered a broad sell-off, with both precious metals and crude oil prices plunging. Spot gold ( XAUUSD) fell by more than $100 intraday, breaking below $4,000 per ounce. At the time of writing, spot gold was trading at $3,992.80 per ounce, down 2.87%. Gold has fallen over 25% from its peak of nearly $5,600 in January this year.
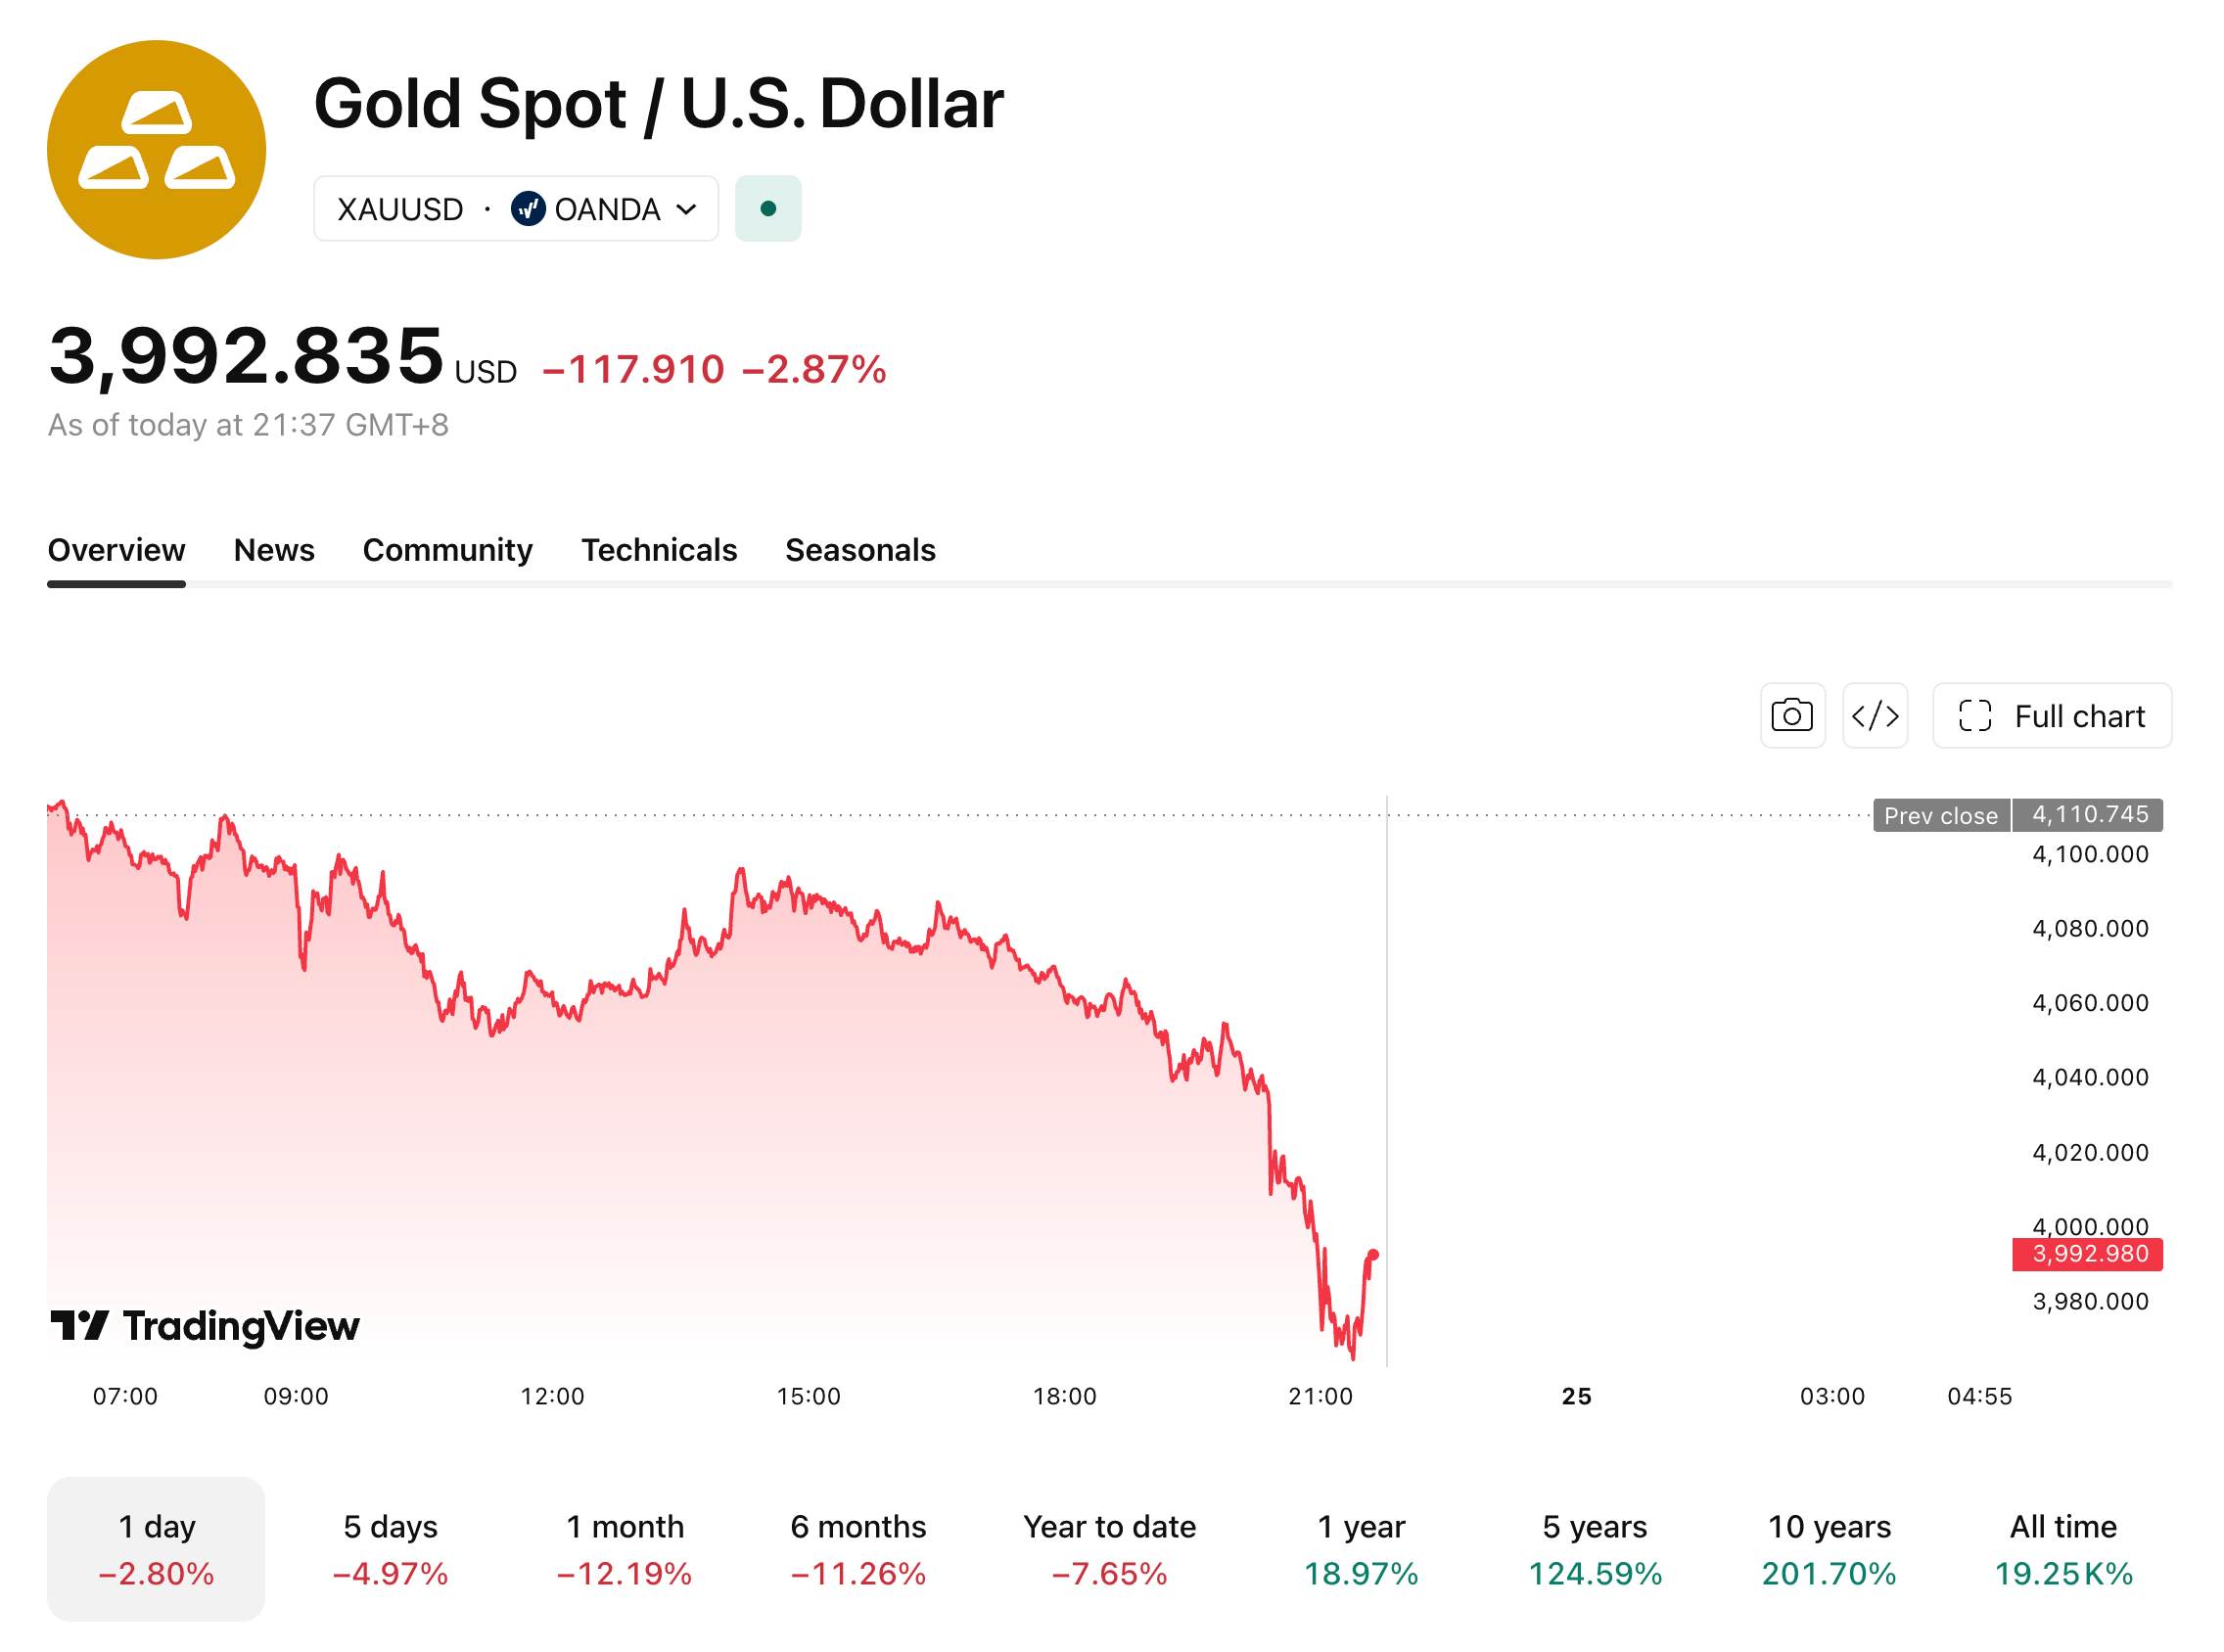
[Gold Price Trend, Source: TradingView]
Spot silver ( XAGUSD) fell over 5% at one point during the day, breaking below the $60 mark. As of writing, it was down 4.64% at $58.70 per ounce, down more than 50% from this year's high of $121.65, hitting its lowest level since December 2025.
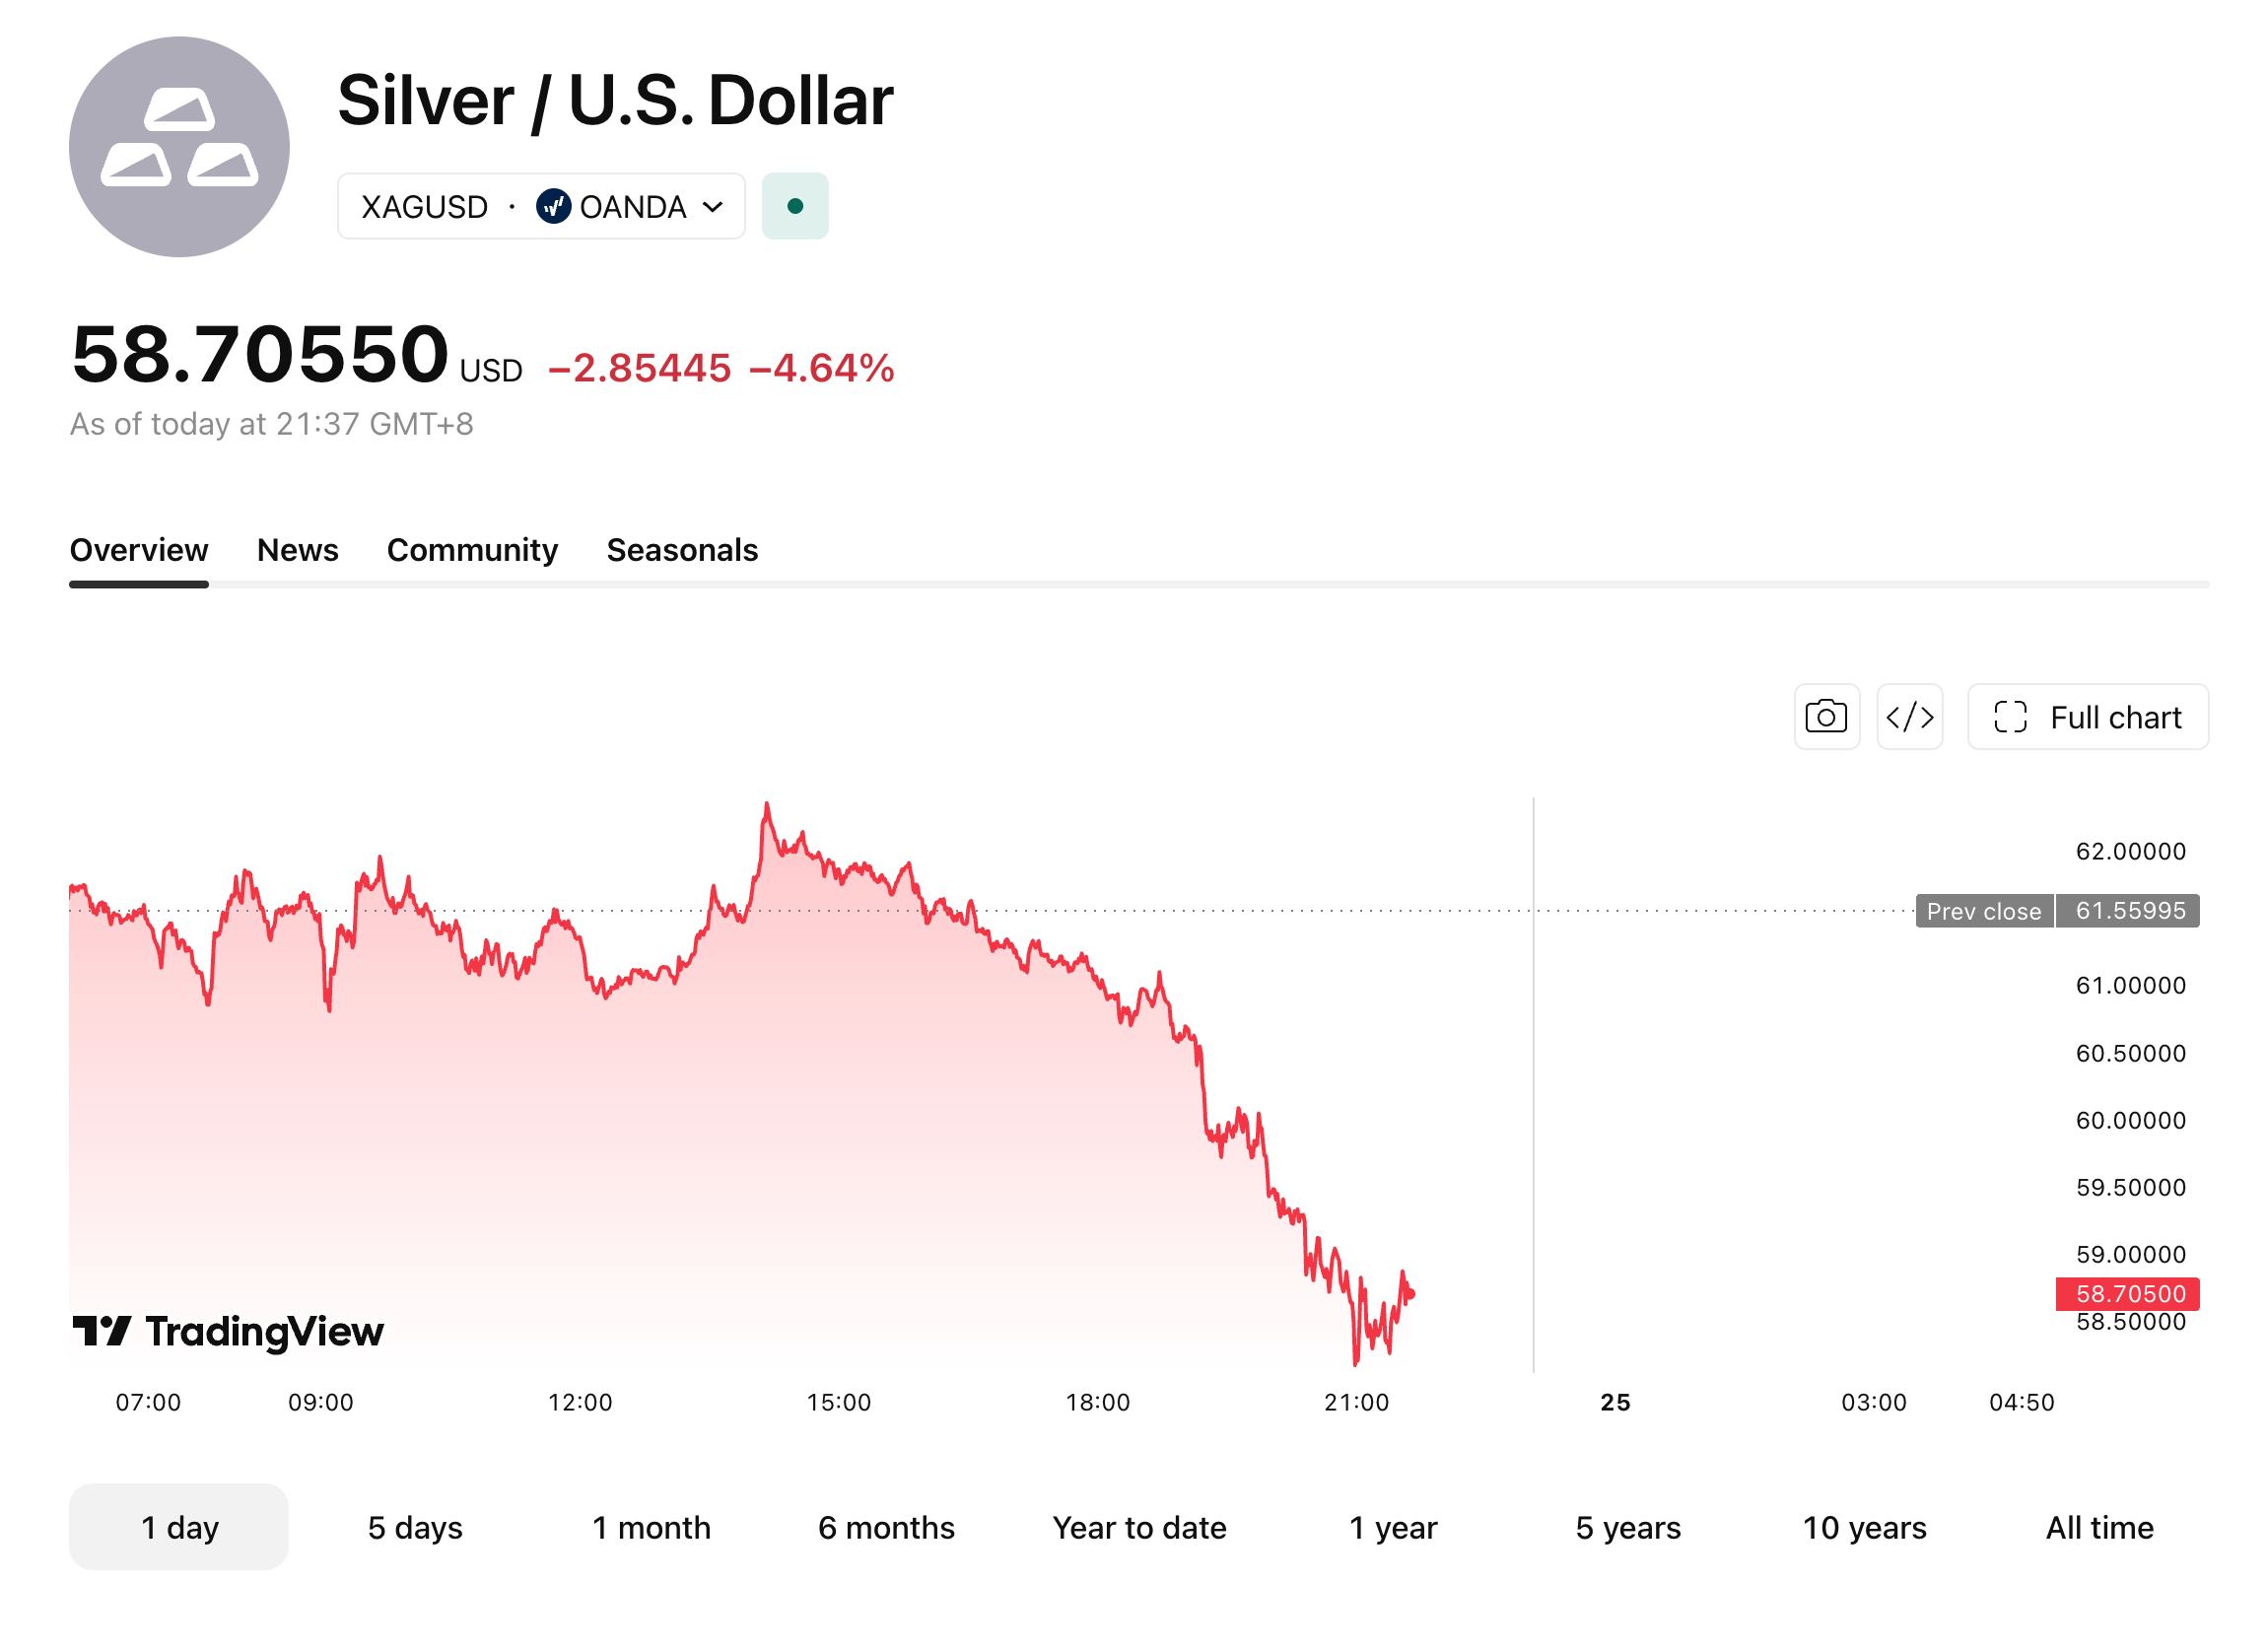
[Silver Price Trend, Source: TradingView]
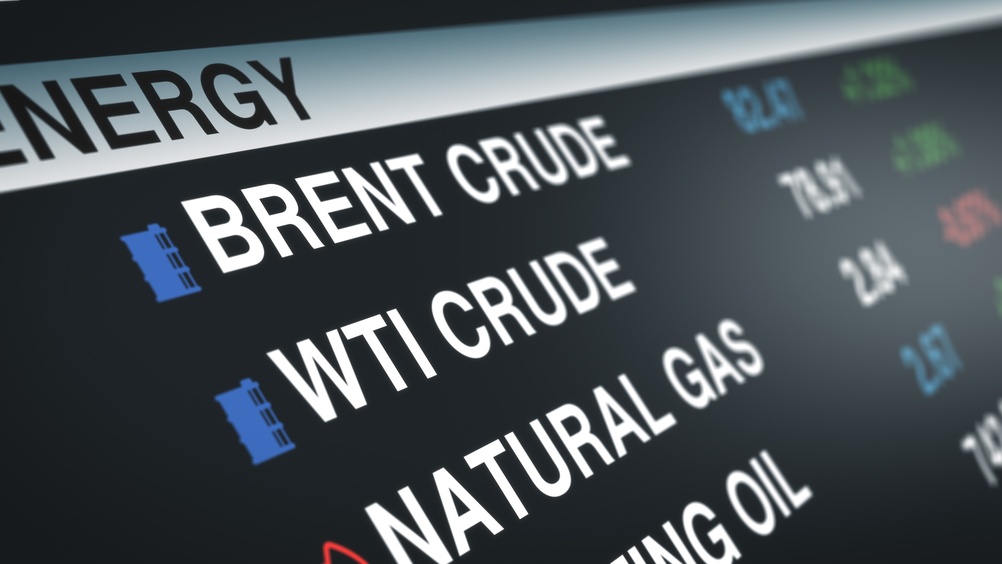
As of writing, WTI crude oil futures fell over 4% to $70.01 per barrel; Brent crude fell 4.09% to $73.80 per barrel, breaking below $76 and returning to levels seen before the outbreak of the war in Iran.
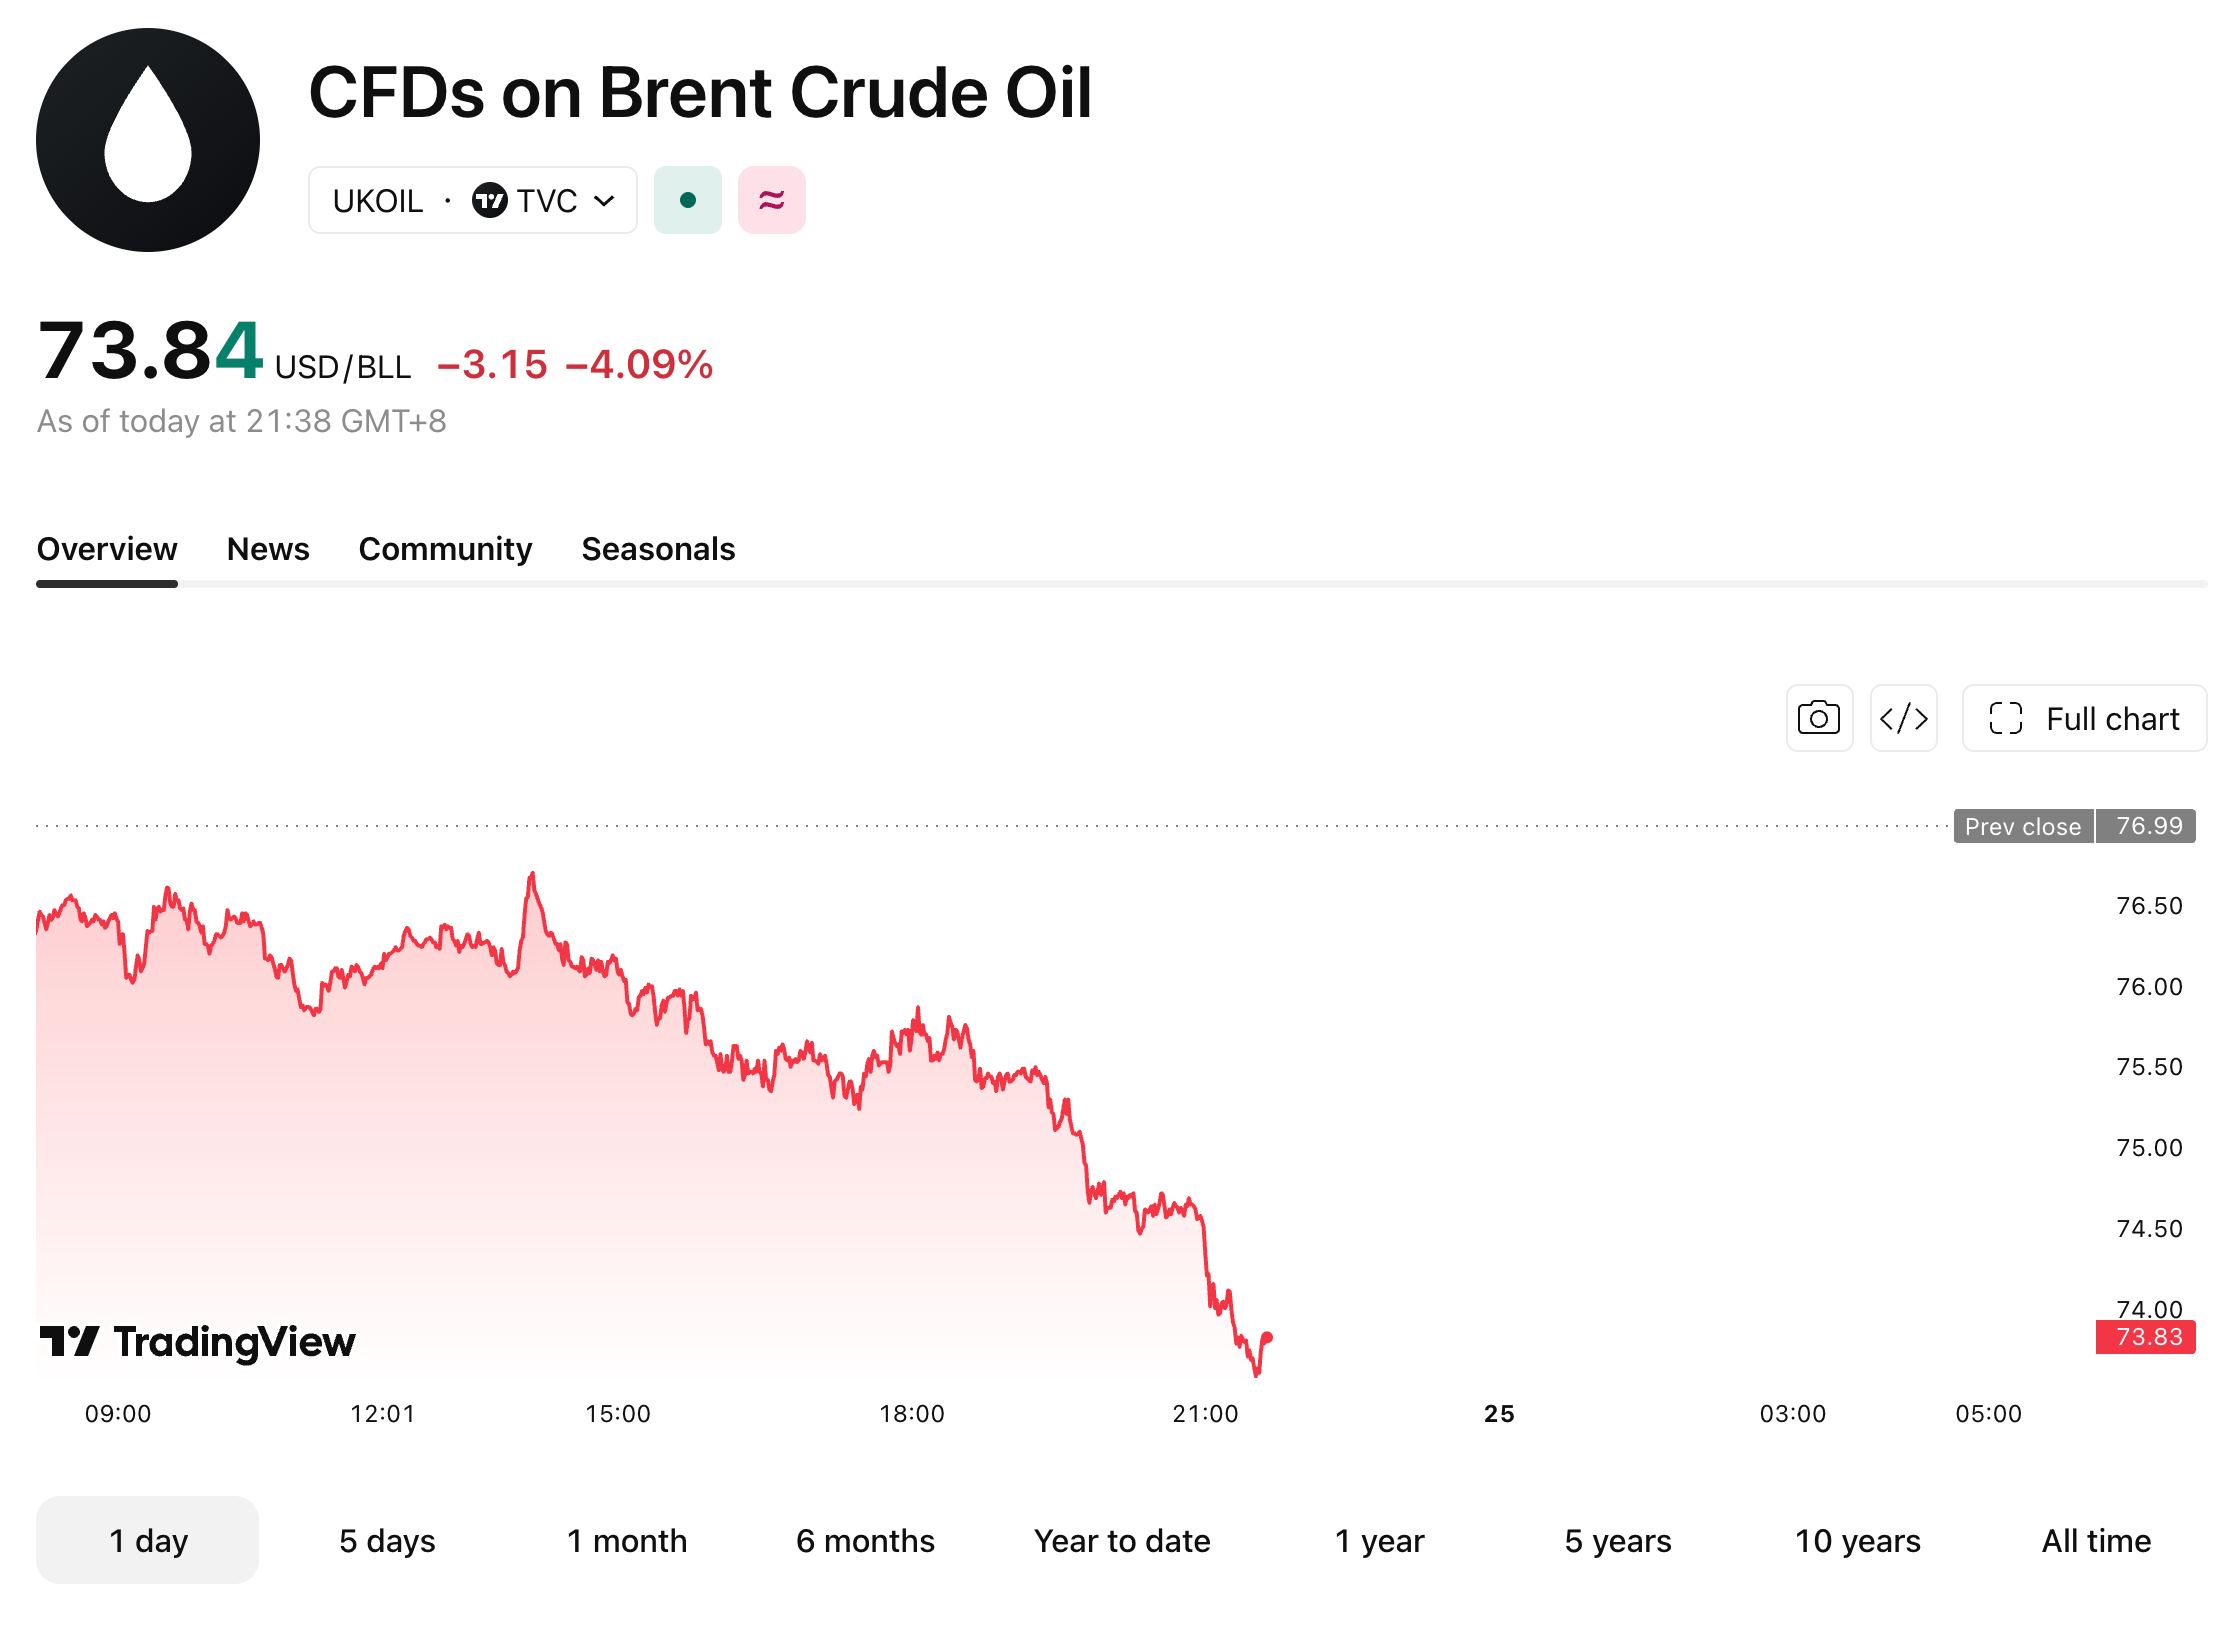
[Source: TradingView]
This sharp drop in precious metals and crude oil was mainly driven by two factors:
First, geopolitical tensions in the Middle East eased and US-Iran negotiations progressed, leading to a continuous unwinding of the geopolitical risk premium for precious metals. Trump stated on social media on the 23rd that Iran had agreed to accept the highest level of nuclear inspections for the long term. Iran's Foreign Ministry spokesperson immediately denied this, stating there were no plans to arrange visits by IAEA inspectors to damaged nuclear facilities.
Trump stated on the 24th that if Iran charges fees to vessels passing through the Strait of Hormuz, peace negotiations with Iran would be terminated. Trump subsequently posted, "Iran has informed the US that it is not collecting transit fees in the Strait of Hormuz." Previously, the US and Iran had signed a memorandum of understanding on a truce and committed to reopening the strait.
Second, US inflation proved more resilient than expected, boosting expectations of Federal Reserve interest rate hikes and putting downward pressure on non-yielding gold. US Fed funds futures indicate a 76% probability of a rate hike in September. Deutsche Bank expects the Fed to hike rates once in September and once in December, for a cumulative 50 basis points; BofA Securities expects three rate hikes this year. The US dollar index rose to around 101.35, its highest level since May 2025.
Amid expectations of Fed tightening, precious metals and risk assets were sold off simultaneously, while volatility in US tech stocks also impacted gold's liquidity.
Goldman Sachs ( GS) lowered its year-end 2026 gold target from $5,400 to $4,900. Deutsche Bank slashed its third-quarter gold price forecast by more than a fifth to $4,300 and cut its fourth-quarter target by 17% to $4,800. In an extreme scenario, if the Fed hikes rates three to four times, gold prices could plunge to $3,800. Citigroup ( C) lowered its three-month gold target from $4,300 to $4,000.
This content was translated using AI and reviewed for clarity. It is for informational purposes only.
Recommended Articles


Comments (0)
Click the $ button, enter the symbol, and select to link a stock, ETF, or other ticker.