

Gold Price Trend Forecast: US-Iran Peace Talks Drive Gold Rebound, Is the Gold Slump Over?


AI Podcast
Gold prices are oscillating near $4,180, down approximately 8% for June, with a short-side bias. News of an impending U.S.-Iran agreement compressed the Middle East risk premium, lowering oil prices, though de-escalation risks persist. Persistent U.S. inflation and interest rate pressures limit gold's upside potential as Treasury yields remain elevated. A weekly close above $4,100 and the SMA60 would strengthen bullish momentum, targeting $4,360. Failure to hold above $4,100 could lead to declines toward $3,900.

TradingKey - As of the Asian session on June 12, gold ( XAUUSD) prices oscillated lower near $4,180. Yesterday, gold prices briefly dipped toward $4,000 before rebounding sharply above $4,200 on news of an impending U.S.-Iran agreement, but with the June decline still as high as approximately 8%, the market remains biased toward the short side.
U.S.-Iran situation dominates market trends
From a fundamental perspective, the U.S.-Iran situation continues to dominate market direction.
Latest reports show that on June 12 ET, Trump stated he would cancel a new round of planned airstrikes against Iran, noting that a U.S.-Iran agreement could be signed in Europe as early as this weekend, with the Strait of Hormuz to reopen following the signing. This news directly compressed the Middle East risk premium, sending oil prices to a two-month low and significantly easing market concerns over energy supply disruptions.
However, the situation has not shifted entirely toward peace. Reports indicate that the Iranian Foreign Minister stated that while most of the negotiating text is complete, Tehran has yet to make a final decision and will not compromise on its "red lines"; meanwhile, the U.S. claimed to have shot down two Iranian drones near the Strait of Hormuz, and Iran intercepted a tanker attempting to pass. Israel denied involvement in the agreement and emphasized that Iran's nuclear and missile issues remain unresolved. This suggests that while the market is trading on expectations of de-escalation, the risk of renewed escalation cannot be entirely ruled out.
At the same time, U.S. inflationary and interest rate pressures have not dissipated. Latest PPI data for May showed a 6.5% year-on-year increase, indicating that the Middle East energy shock has already passed through to upstream prices. Previous CPI data also showed U.S. inflation rising to 4.2%. Even if oil prices retreat on expectations of peace, it remains difficult for the Federal Reserve to pivot to a distinctly dovish stance ahead of its June meeting. As long as Treasury yields remain elevated, the room for a rebound in gold, a non-interest-bearing asset, will be limited.
Gold Price Trend Analysis: Bull-Bear Decision Hinges on Weekly Close Above $4,100
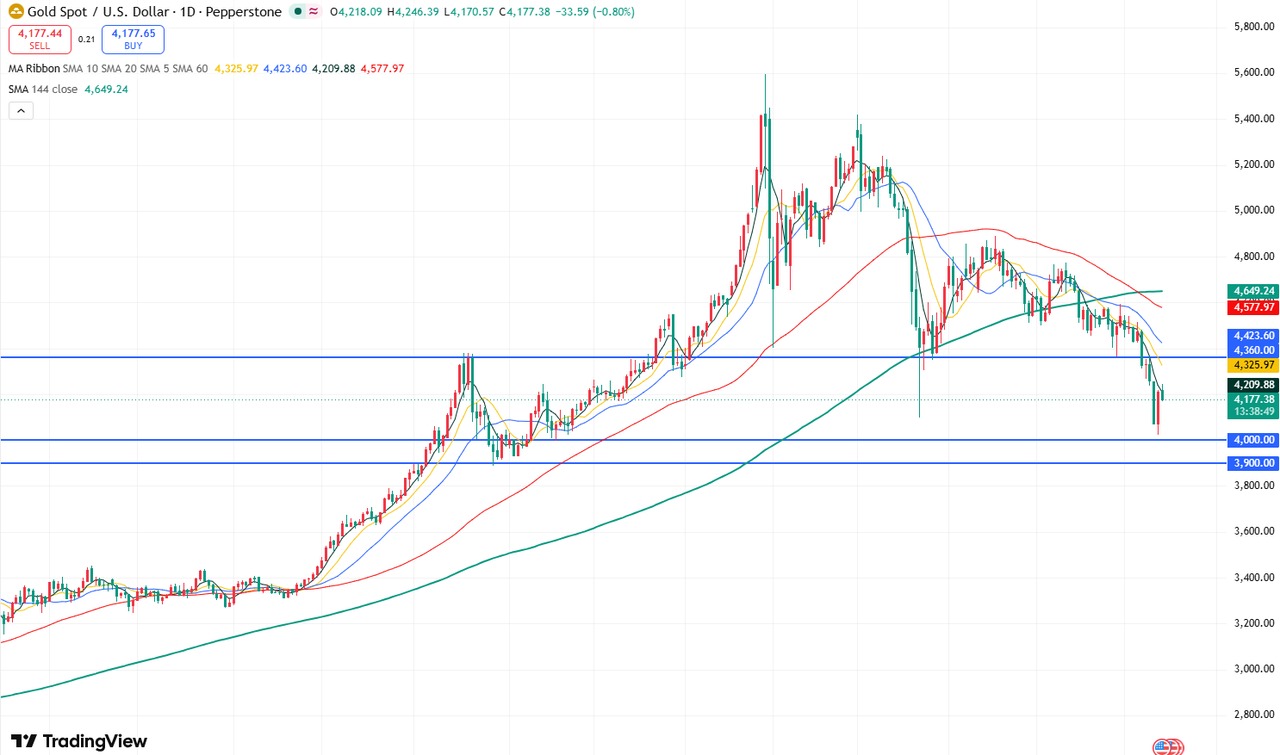
Gold price daily chart, Source: TradingView
Based on the gold daily chart, prices rebounded sharply after dropping to the $4,000 psychological level yesterday, fueled by expectations of U.S.-Iran peace talks, and briefly broke above $4,200. However, today's price action remains pressured below the 5-day moving average, maintaining a weak intraday decline that could extend the recent downward trend and retest the $4,000 support level.
If the price can effectively break above the 5-day moving average resistance intraday, gold may open up upside potential toward the $4,300-$4,360 range.
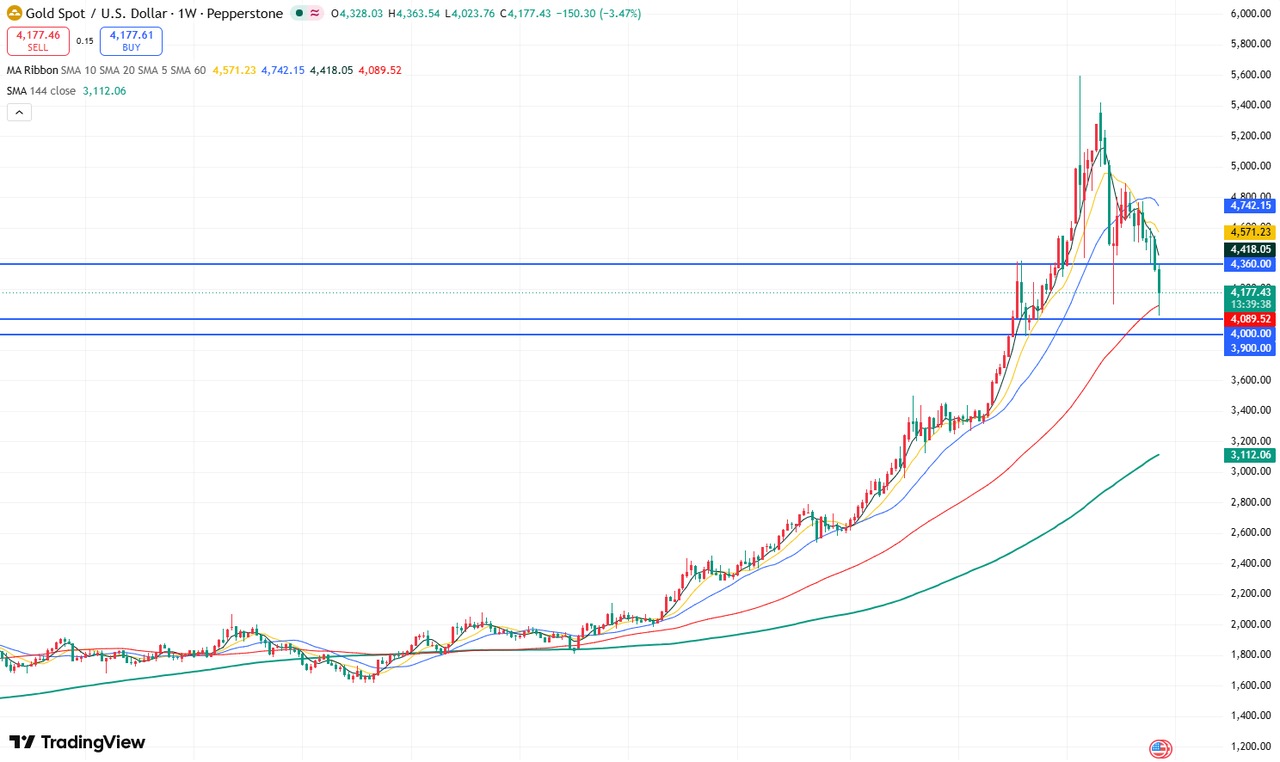
Gold price weekly chart, Source: TradingView
On the gold weekly chart, prices briefly dipped below the $4,100 support level before returning above it. The weekly closing price is expected to hold firm above $4,100 and the 60-period simple moving average (SMA60), potentially forming a support confluence structure.
If the weekly close is confirmed above $4,100 and the SMA60, bullish momentum will strengthen significantly, supporting a rebound to test the $4,360 resistance level, with further resistance at $4,480.
Conversely, if the weekly close falls below $4,100 and breaks the SMA60, gold prices will open up downside room toward $3,900, with a potential further decline toward $3,500.
This content was translated using AI and reviewed for clarity. It is for informational purposes only.
Recommended Articles


Comments (0)
Click the $ button, enter the symbol, and select to link a stock, ETF, or other ticker.