

When Will the Gold Dilemma Be Resolved? Breakdown of US-Iran Negotiations Puts Gold Prices Under Pressure Again, Can It Return to $5,000?


AI Podcast
Spot gold fell below $4,700, impacted by collapsed U.S.-Iran talks, high oil prices, and dollar resilience. Elevated interest rates and strong U.S. labor data bolster the dollar, suppressing gold by increasing opportunity costs and safe-haven demand for Treasuries. Despite these headwinds, a medium-term bullish outlook persists, supported by sustained central bank purchases and potential speculative demand. Goldman Sachs maintains a $5,400 year-end target. Physical demand is muted by high prices, but central bank buying and recent ETF inflows suggest underlying institutional support. Short-term caution is advised, with potential accumulation on significant pullbacks.
TradingKey - Spot gold broke below the $4,700 level during the Asian trading session on May 11, dropping as low as $4,678. As of press time, it was trading at $4,670, in stark contrast to three days ago when prices neared the $4,900 mark.
Earlier, U.S.-Iran negotiations collapsed after Trump slammed Iran's conditions as 'completely unacceptable,' with Israeli Prime Minister Netanyahu subsequently declaring that Iran's uranium enrichment facilities must be destroyed.
High Oil Prices and Dollar Resilience Weigh on Gold Prices
High oil prices are gradually driving up inflation expectations, leading the market to price in no further rate cuts from the Federal Reserve this year. The maintenance of high interest rates continues to draw capital toward the U.S. dollar and Treasuries, weighing on dollar-denominated gold.
Meanwhile, after March U.S. CPI hit 3.3% year-on-year, market analysis suggests that if energy costs are fully passed through, core PCE inflation could remain near 3% this year, well above the Fed's 2% policy target.
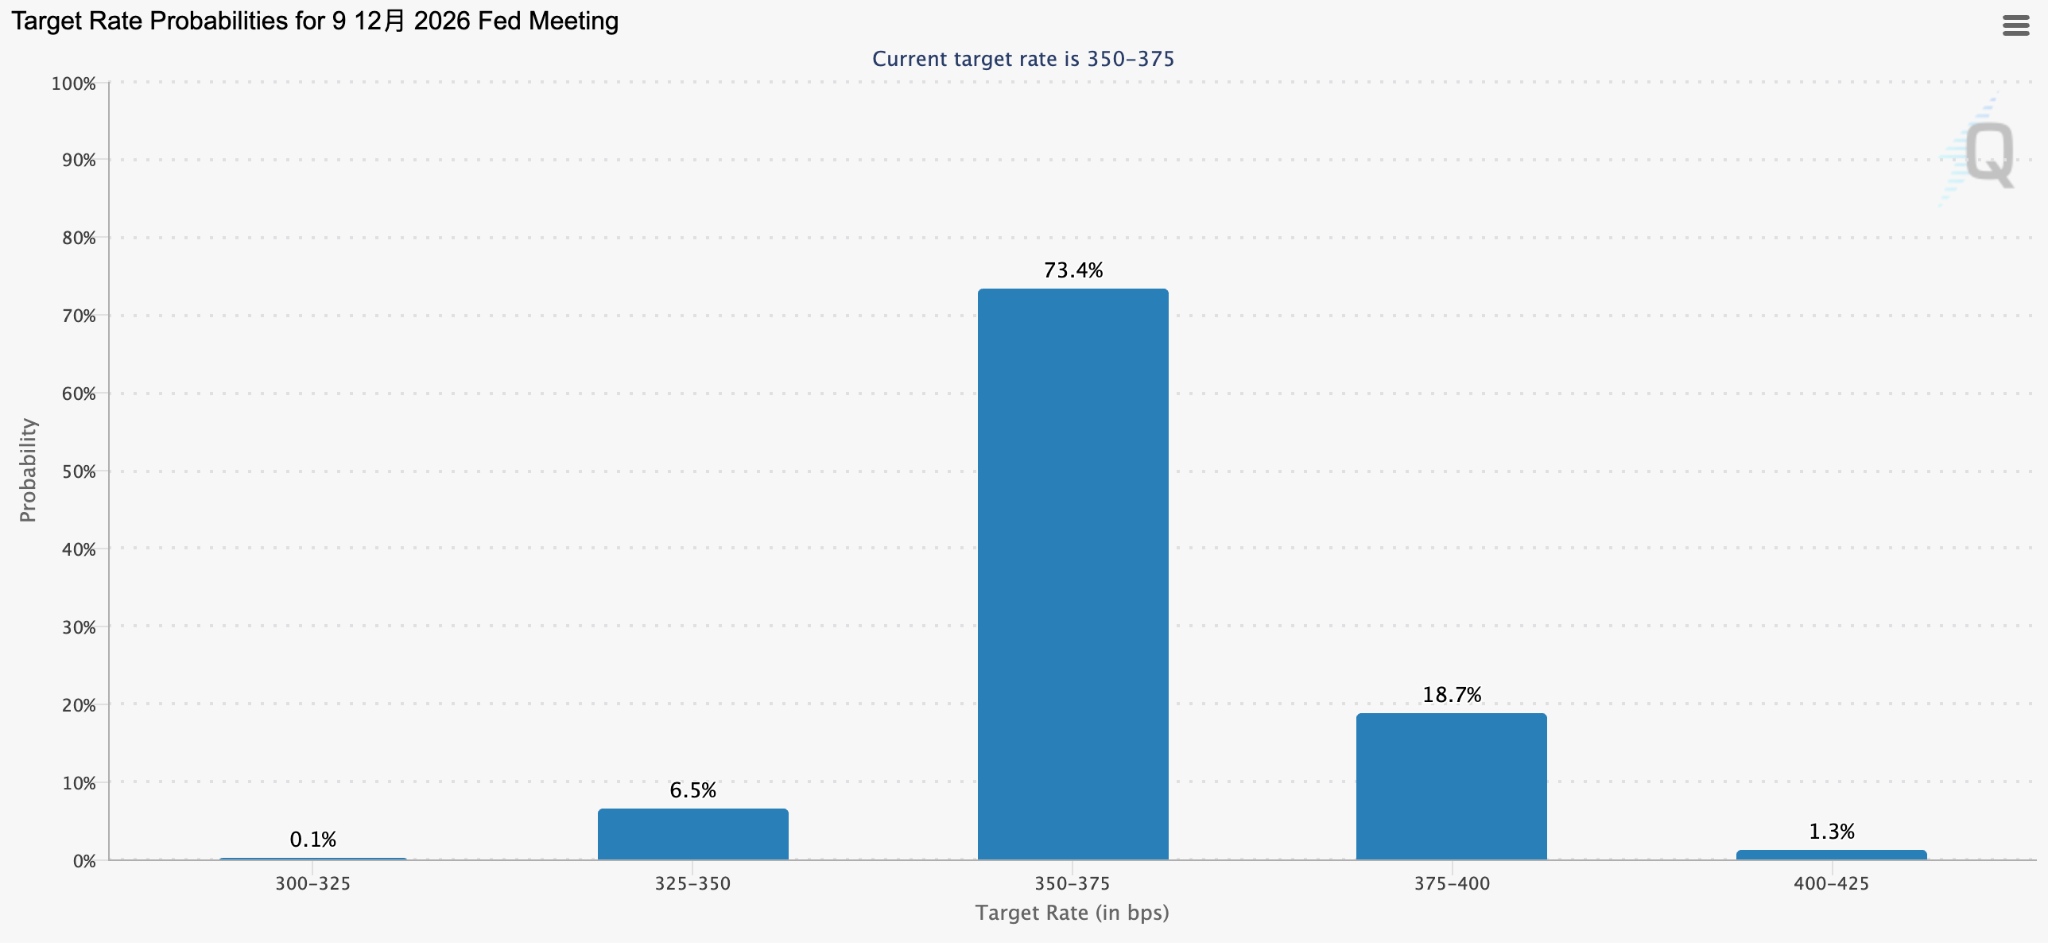
[Rate cut probability through the end of 2026, Source: CME FedWatch]
Although some institutions still see room for a 25-basis-point rate cut this year, FedWatch data shows the market is betting heavily against any further cuts, with the tail risk of a rate hike now significantly outweighing the probability of a cut.
At the same time, robust non-farm payrolls and an unemployment rate below 4% are fueling dollar strength. Combined with the ongoing stalemate in the Middle East, safe-haven demand continues to flow back to the greenback, keeping the U.S. Dollar Index resilient in the 98-100 range.
Against this backdrop, gold is unlikely to see an independent breakout in the short term.
Institutions Collectively Position Long and Short on Gold
While short-term gold prices are suppressed by multiple factors, the structural foundation for a medium-term bullish outlook remains intact and has been repeatedly reinforced.
In its April 30 research report, Goldman Sachs maintained its year-end gold price target of $5,400, citing its three core pillars: sustained central bank purchases, a rebound in speculative demand, and the Federal Reserve's rate-cut cycle, which will lower the opportunity cost of holding gold.
The World Gold Council's first-quarter report indicates that global central banks net purchased 244 tonnes of gold in Q1, surpassing the previous quarter's 208 tonnes and hitting a more than one-year high; China added 7 tonnes in Q1, while Poland and Uzbekistan were the largest disclosed buyers.
Despite a 23% year-on-year drop in global gold jewelry consumption volume in the first quarter, the value of gold jewelry consumption still grew by 31%. High prices are dampening physical demand, but central bank buying and speculative demand are temporarily filling the gap.
Some market participants suggest that the structural rise in U.S. inflation expectations may keep inflation relatively manageable. While headline U.S. inflation has reached a two-year high of 3.3%, core inflation has moderately receded to 2.6% and remains within a manageable range, which is unlikely to compel central banks to maintain extremely hawkish policies.
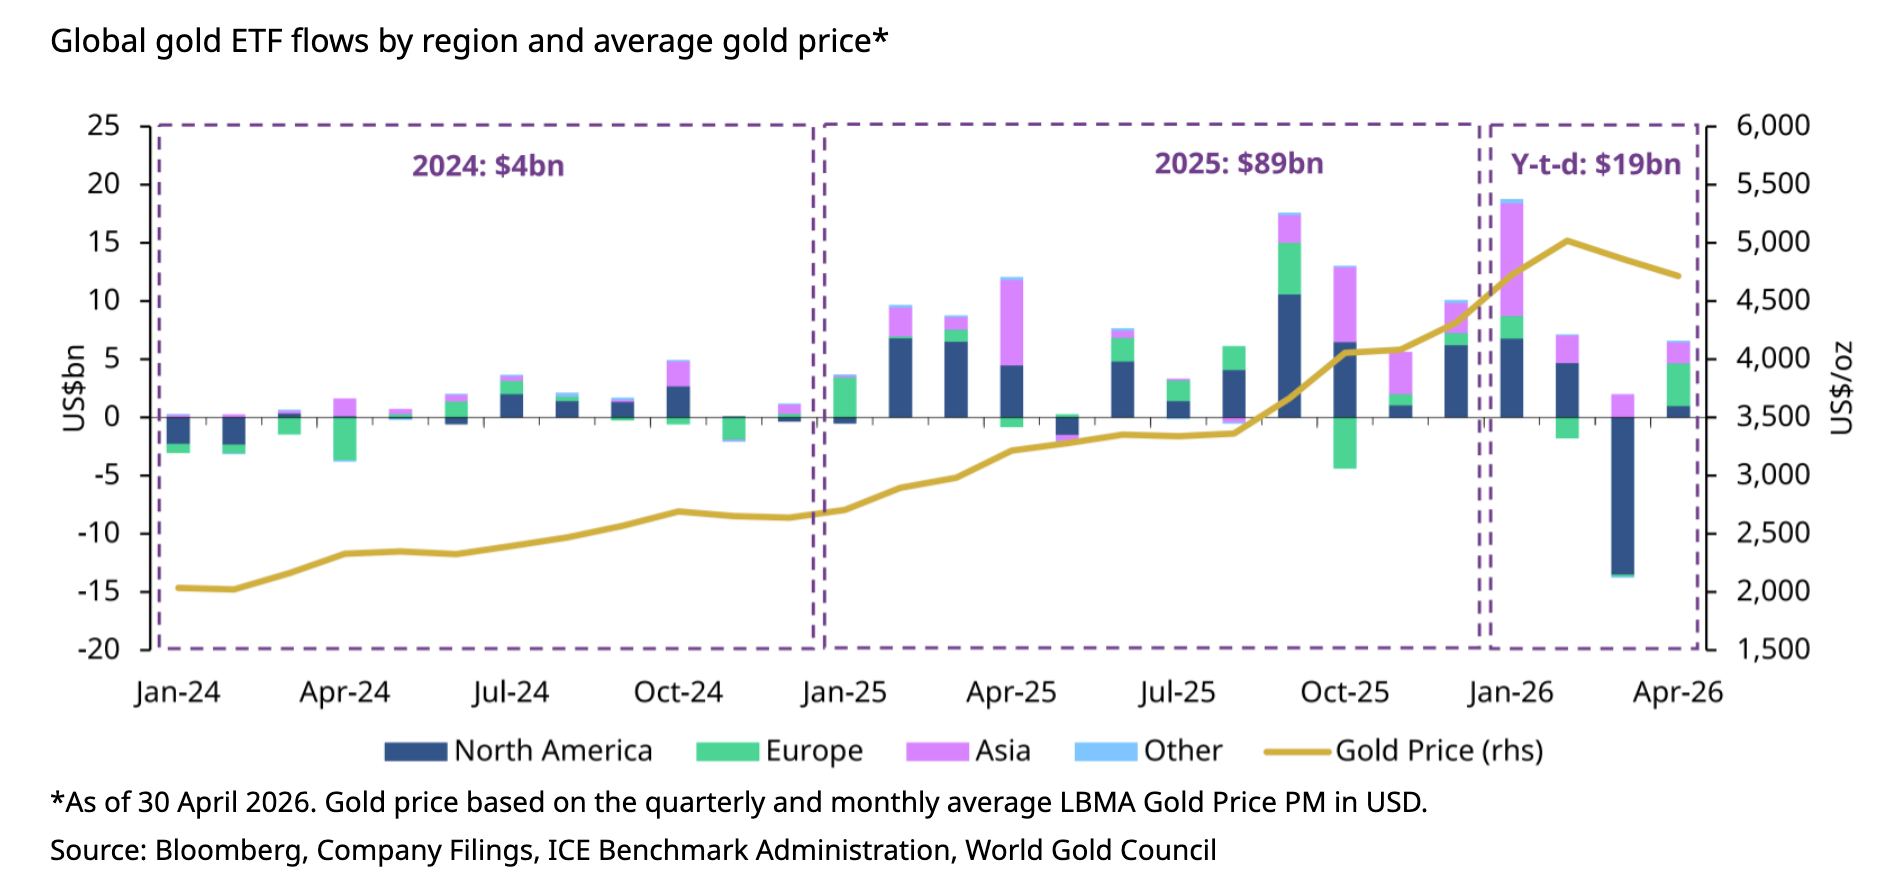
[Gold ETF Flows Turned Positive in April, Source: World Gold Council]
Simultaneously, global physical gold ETFs switched to net inflows of $6.6 billion in April, reversing the massive outflow trend of approximately $12 billion in March. Europe led the market with $3.7 billion in contributions, and the Asian market recorded its eighth consecutive month of net inflows.
How should investors position for gold at this juncture?
Gold ETF flow data suggests that short-to-medium-term market sentiment is diverging significantly. However, persistent net inflows from Asian markets, combined with short-covering in the West, indicate that the underlying strength of institutional allocation should not be underestimated.
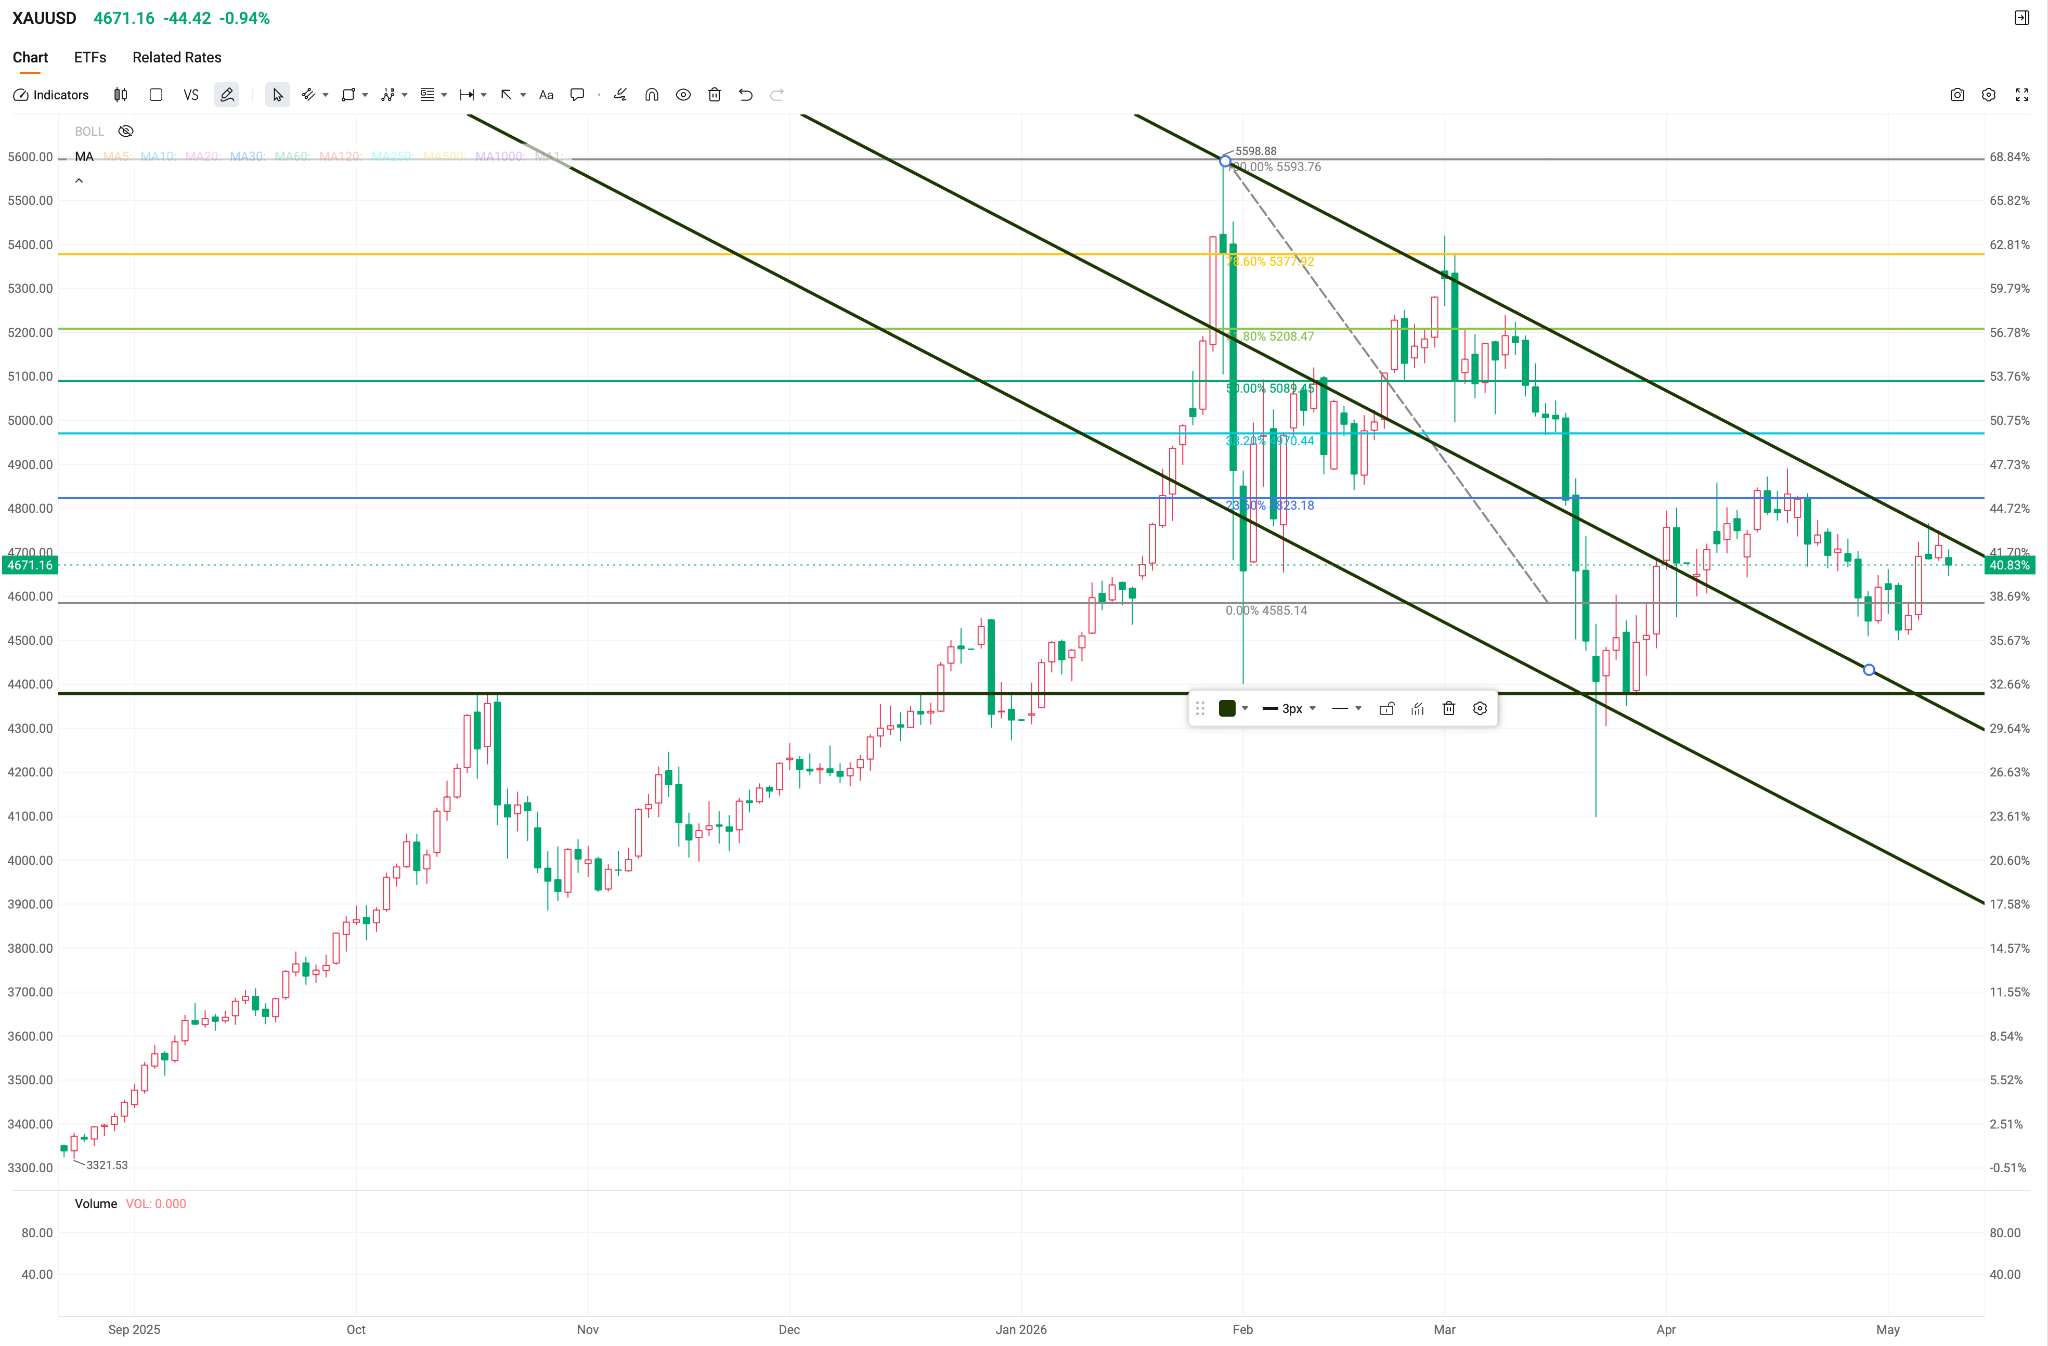
[Gold Daily Candlestick Chart, Source: TradingKey]
From a technical standpoint, gold's short-term downward momentum has yet to reverse, and its descending channel remains intact. Consequently, short-term investors should exercise caution regarding heavy positions. For risk-averse investors, initiating small positions at key support levels could yield positive returns.
Since gold's safe-haven status remains a fundamental market consensus, and in view of rising inflation expectations, any significant pullback may serve as an opportunity to accumulate positions for the next leg up.
This content was translated using AI and reviewed for clarity. It is for informational purposes only.
Recommended Articles


Comments (1)
Click the $ button, enter the symbol, and select to link a stock, ETF, or other ticker.