

Gold Hovers at $4,000 Crossroads: Breakout or Pullback Ahead?


AI Podcast
Gold retreated from its $4,381 all-time high but has since stabilized around $4,000. Structural tailwinds, including central bank buying, resilient retail demand, geopolitical risks, and a dovish Federal Reserve, suggest a choppy upward trajectory may resume. Global central banks, particularly China, continue robust gold accumulation, and Chinese retail demand is strong. Geopolitical fragilities persist, and the Fed's dovish pivot supports gold. However, a cooling risk-off sentiment and technical overextension led to profit-taking. Near-term momentum is cautious, with the path forward hinging on geopolitical events or economic data shifts. Technically, gold is consolidating but the broader uptrend remains intact.

TradingKey - Gold retreated sharply after hitting an all-time high of $4,381 on October 20, briefly breaching the $3,900 level as profit-taking by bullish traders unwound a significant portion of accumulated long positions—effectively cooling speculative fervor. Since October 30, however, the metal has stabilized in a narrow range and reclaimed the psychological $4,000 threshold, reigniting the key question: Is another leg higher in the cards—or is a deeper correction underway?
While the move marks a textbook pullback following a parabolic rally, structural tailwinds—including sustained central bank buying, resilient retail demand, geopolitical fragility, and an increasingly dovish Federal Reserve—suggest gold could resume a choppy, higher trajectory in Q4 2025, potentially retesting its record peak near $4,380.
Central banks remain pivotal. Seeking to diversify away from dollar-denominated reserves, they’ve maintained robust gold accumulation. According to the World Gold Council’s October 30, 2025 report, global official sector net purchases totaled 634 tonnes in the first three quarters of the year, with Q3 alone accounting for 220 tonnes—a 28% sequential increase. The People’s Bank of China added 5 tonnes in the quarter, bringing its official gold reserves to 2,304 tonnes.
China’s retail gold frenzy shows no signs of abating. Year-to-date, domestic gold ETF assets have surged over 40% YoY, reflecting strong investor appetite via exchange-traded and accumulation products. Retail momentum is equally robust: gold and jewelry sales in the first five months of 2025 rose 12.3% year-on-year—more than triple the 4.1% growth in overall social consumption. Investment-grade products like bars and coins saw sales jump over 20%, while innovation-driven offerings—such as gufa (ancient-craft) gold and 5G-gold jewelry—are successfully drawing in younger demographics.
Meanwhile, geopolitical risk remains a persistent tailwind. Although a fragile ceasefire between Israel and Hamas—brokered by multiple mediators—has temporarily eased Middle East tensions, the region’s deep-seated historical, religious, and ethnic fault lines, compounded by competing political and economic interests, leave the truce vulnerable to collapse. Any flare-up would swiftly reignite safe-haven demand.
The Fed’s dovish pivot further underpins the bull case. On October 30, the central bank delivered its fifth rate cut of 2025, lowering the target range by 25 bps to 3.75%. Market pricing, per CME’s FedWatch Tool, had fully anticipated the move—assigning a 98.3% probability to a 25-bp cut, versus just 1.7% for a hold. With the Fed’s revised forecasts pointing to an extended easing cycle, real rates are set to remain supportive for non-yielding assets like gold.
That said, gold has faced notable headwinds since its October 21 peak above $4,380. The pullback—extending below $3,900 at one point—reflects both a cooling in risk-off sentiment (aided by tentative progress in U.S. trade talks and no major escalation in Ukraine or the Middle East) and technical overextension. After the record surge, positioning grew crowded, prompting a wave of profit-taking to rebalance speculative excess.
Currently, sentiment has turned cautious. Investors are adopting a wait-and-see stance, and with macro catalysts in short supply, near-term momentum for a sustained rally remains elusive. The path forward likely hinges on the next geopolitical shock—or a sharper-than-expected deterioration in U.S. labor or inflation data.
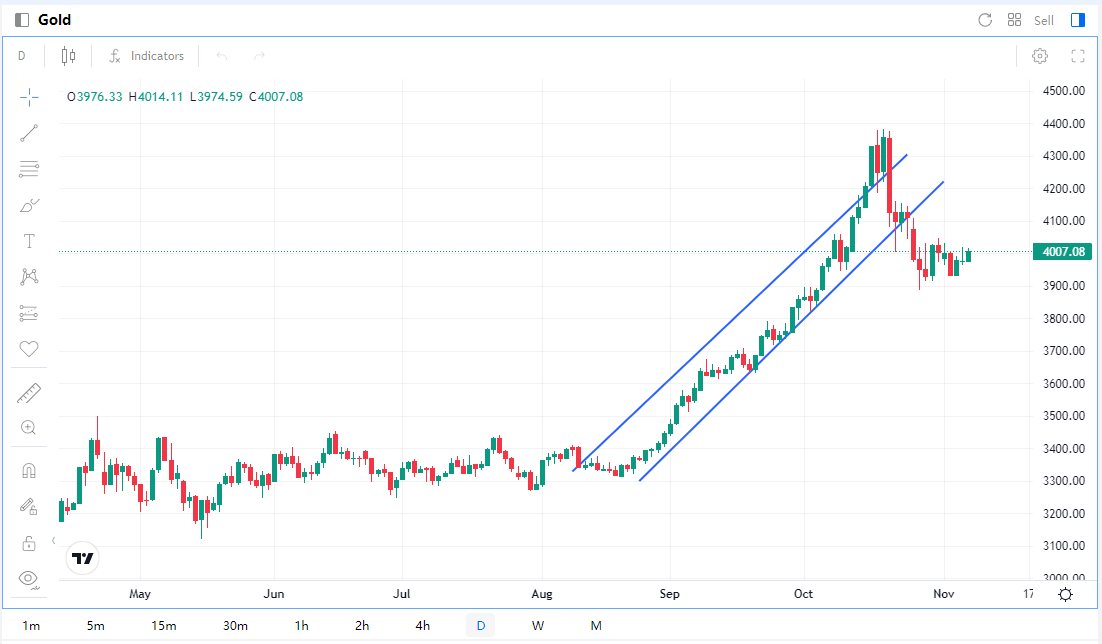
Source: Mitrade — Gold Price Action
From a technical perspective, gold has entered a period of sideways consolidation following its retreat from the $4,380 all-time high, showing no clear directional momentum in the near term—yet the broader uptrend remains structurally intact.
On the daily chart, moving averages have converged into a tight cluster, reflecting equilibrium between bulls and bears. Meanwhile, the stochastic oscillator hovers near the 50 midpoint, with both %K and %D lines turning upward—a nascent signal that bullish momentum may be reaccumulating and could reignite upward price action.
Upside resistance: Initial at $4,100, followed by $4,300, with the psychological and cycle-high barrier at $4,400.
Downside support: First test likely at $3,850, then $3,750, with critical structural support at $3,700—a level that would signal deeper correction risk if breached.
Recommended Articles


Comments (0)
Click the $ button, enter the symbol, and select to link a stock, ETF, or other ticker.