GBP/JPY Price Forecast: SMA resistance stalls bulls near 213.00



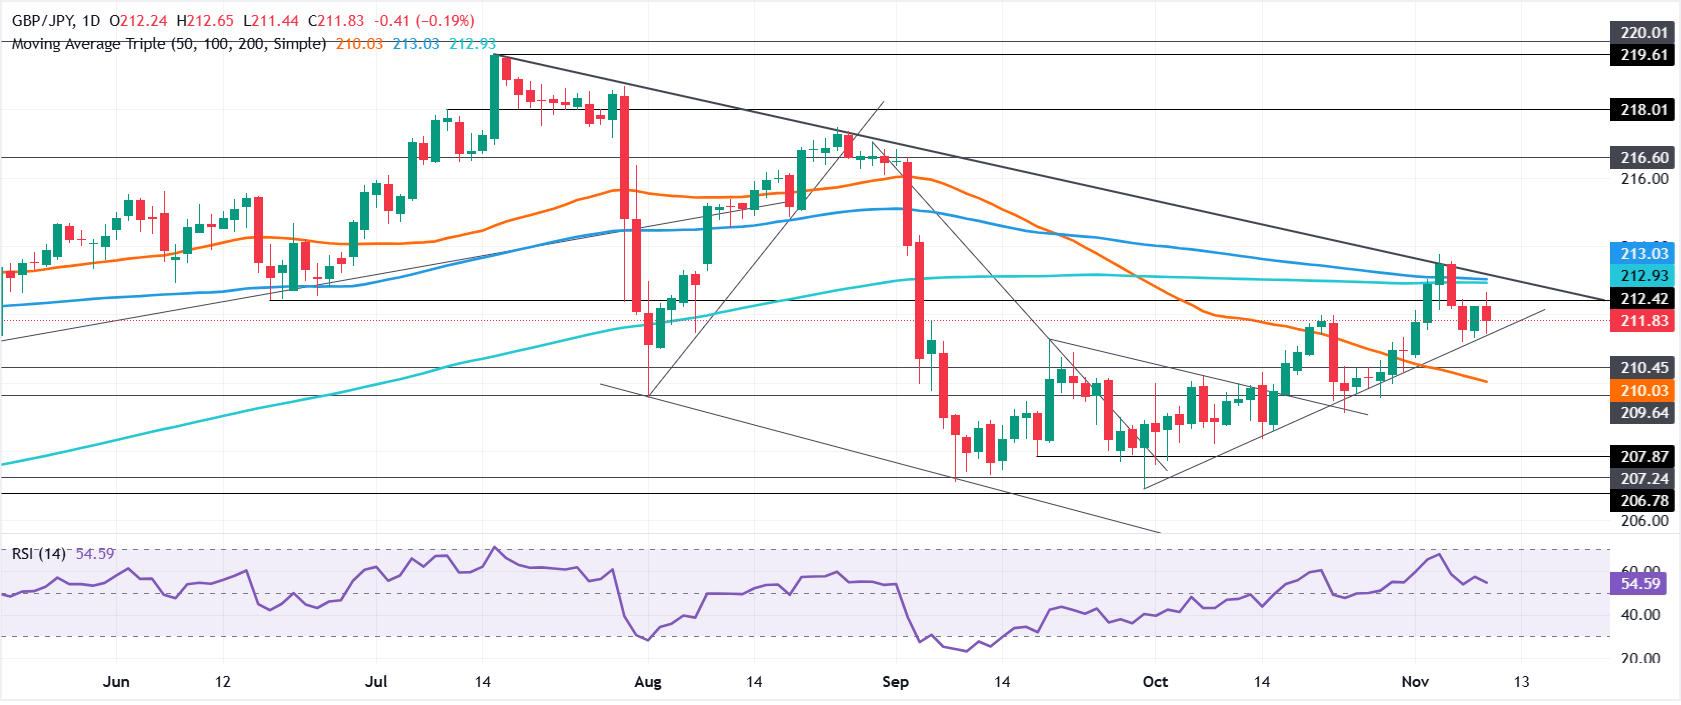
- GBP/JPY retreats toward 211.78, remaining below critical SMA resistance.
- RSI stays bullish but slopes lower, signaling weakening buying momentum.
- Break below 211.19 exposes 50-day SMA at 210.03 and 209.13.
The GBP/JPY falls by about 0.22% as the US Dollar strengthens on hawkish comments from Federal Reserve (Fed) officials, boosting safe-haven currencies like the Japanese Yen against the Pound Sterling. The cross trades at 211.78.
GBP/JPY Price Forecast: Technical outlook
From a technical standpoint, the GBP/JPY continues to drift higher, though it remains below the crucial 100- and 200-day Simple Moving Averages (SMAs), each at 212.93 and 213.03, respectively. Momentum remains bullish, but buyers are losing traction as the Relative Strength Index (RSI) drifts lower.
For a bullish continuation, the first resistance for GBP/JPY is the 212.93-213.03 area. A breach of the latter will expose a resistance trendline near the past 213.20. Up next, the 214.00 figure emerges as the next area of interest, followed by the August 25 high at 217.48.
On the flip side, the first support is last Friday’s low of 211.19. Once cleared, the next stop is the 50-day SMA at 210.03, followed by the October 23 swing low of 209.13.
GBP/JPY Price Chart – Daily
Japanese Yen Price Today
The table below shows the percentage change of Japanese Yen (JPY) against listed major currencies today. Japanese Yen was the strongest against the Australian Dollar.
| USD | EUR | GBP | JPY | CAD | AUD | NZD | CHF | |
|---|---|---|---|---|---|---|---|---|
| USD | 0.47% | 0.70% | 0.51% | 0.49% | 0.90% | 0.50% | 0.68% | |
| EUR | -0.47% | 0.22% | 0.04% | 0.02% | 0.42% | 0.03% | 0.21% | |
| GBP | -0.70% | -0.22% | -0.19% | -0.18% | 0.20% | -0.23% | -0.01% | |
| JPY | -0.51% | -0.04% | 0.19% | -0.01% | 0.40% | -0.01% | 0.18% | |
| CAD | -0.49% | -0.02% | 0.18% | 0.00% | 0.41% | 0.00% | 0.19% | |
| AUD | -0.90% | -0.42% | -0.20% | -0.40% | -0.41% | -0.40% | -0.22% | |
| NZD | -0.50% | -0.03% | 0.23% | 0.00% | -0.00% | 0.40% | 0.18% | |
| CHF | -0.68% | -0.21% | 0.01% | -0.18% | -0.19% | 0.22% | -0.18% |
The heat map shows percentage changes of major currencies against each other. The base currency is picked from the left column, while the quote currency is picked from the top row. For example, if you pick the Japanese Yen from the left column and move along the horizontal line to the US Dollar, the percentage change displayed in the box will represent JPY (base)/USD (quote).